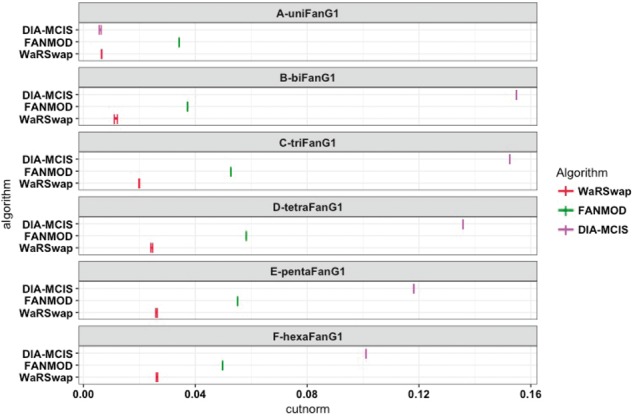
Fig. 2.

Small uneven graph sampling performance. For each small uneven graph and algorithm, 5000 graphs were generated and the cut norm estimates for each algorithm were computed using IndeCut. The vertical lines represent lower and upper bounds returned by the cut norm estimation with the true (NP-hard) value lying in this interval. A cut norm interval that is far from zero represents less uniform and independent sampling. With the exception of uniFanG1, the cut norm estimates for CoMoFinder were much larger than 0.16, and hence are not shown for ease of comparison (see Supplementary Table S1 and Fig. S3 for detailed results)
