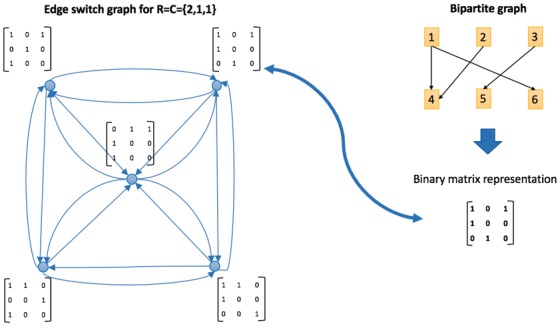
Fig. 5.

Constructing an ESG. An initial bipartite graph (top right) with degree sequence of produces a sample space containing five different graphs which are represented as nodes in the ESG (left). The zero-one matrices represent the edge configuration of each node. An edge connects two nodes (graphs) which can be converted to each other by performing one edge switch
