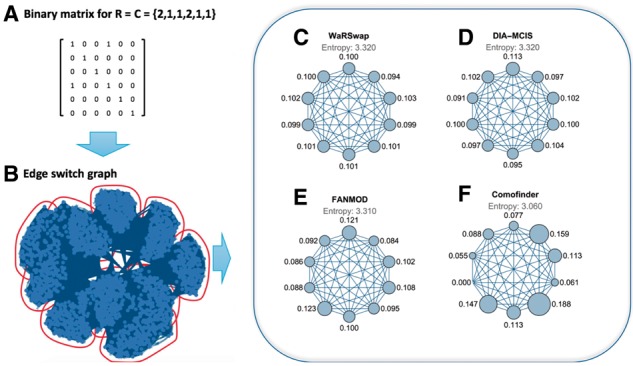
Fig. 6.

An example ESG for degree sequence . (A) The 0-1 matrix of the initial graph. (B) ESG corresponding to this degree sequence (dots represent graphs in sample space) with detected clusters outlined. (C–F) Cluster-time diagrams for each examined algorithm; nodes represent clusters in the ESG with node size indicating the fraction of times a given algorithm sampled graphs in that cluster
