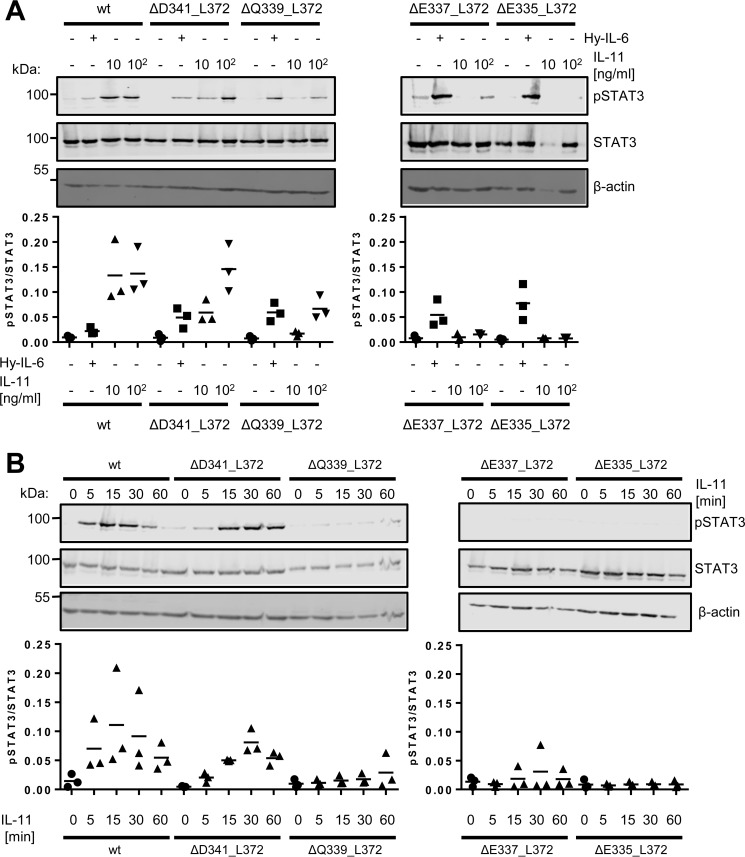
Figure 6.
Influence of cytokine concentration and duration of stimulation on IL-11–induced STAT3 phosphorylation. A, Ba/F3–gp130–IL-11R, Ba/F3–gp130–IL-11RΔD341_L372, Ba/F3–gp130–IL-11RΔQ339_L372, Ba/F3–gp130–IL-11RΔE337_L372, and Ba/F3–gp130–IL-11RΔE335_L372 cells were stimulated with either 10 ng/ml Hy–IL-6, 10 ng/ml IL-11, 100 ng/ml IL-11, or left untreated for 15 min. STAT3 phosphorylation was determined by Western blotting, and total STAT3 was visualized to ensure equal protein loading. The ratio of pSTAT3/STAT3 was determined from three independent experiments. B, Ba/F3–gp130–IL-11R, Ba/F3–gp130–IL-11RΔD341_L372, Ba/F3–gp130–IL-11RΔQ339_L372, Ba/F3–gp130–IL-11RΔE337_L372, and Ba/F3–gp130-IL–11RΔE335_L372 cells were stimulated with 10 ng/ml IL-11 for different time periods (0–60 min). STAT3 phosphorylation was determined by Western blotting, and total STAT3 was visualized to ensure equal protein loading. The ratio of pSTAT3/STAT3 was determined from three independent experiments.

