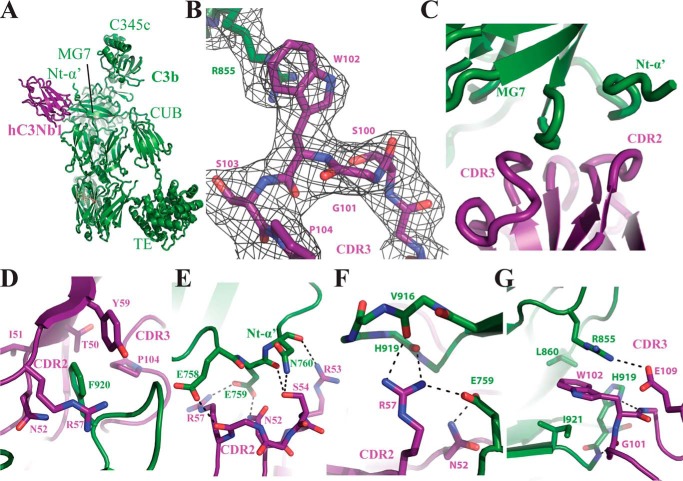
Figure 2.
The crystal structure of the C3b–hC3Nb1 complex. A, cartoon representation of the complex showing the Nb located close to the MG7 domain and the Nt-α′ region. B, omit 2mFo − DFc electron density contoured at 1σ around the CDR3 loop of hC3Nb1 and Arg855 of C3b. C, overview of the interaction surface between C3b and hC3Nb1 involving CDR2 and CDR3 from the Nb and MG7 and Nt-α′ of C3b. D–G, details of the interaction between hC3Nb1 and C3b. Salt bridges and hydrogen bonds are indicated by black dotted lines.

