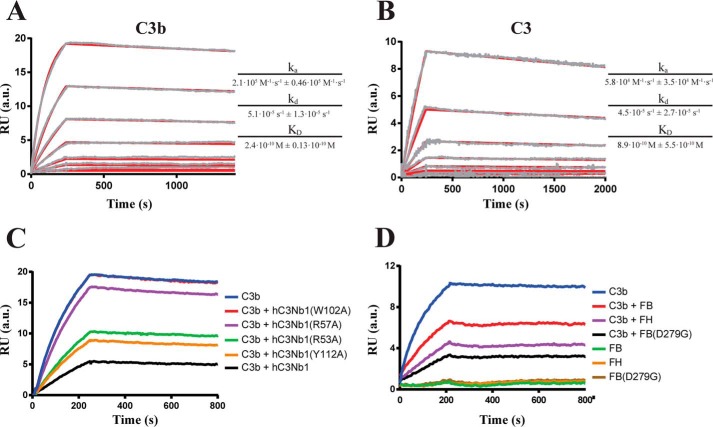
Figure 5.
SPR analysis of the interaction of hC3Nb1 with C3b and C3. A and B, representative SPR concentration series for C3b (A) or C3 (B) are displayed. The measured (gray) and fitted (red) SPR curves are shown for 50, 20, 10, 5, 2, 1, 0.25, and 0.1 nm for C3b or 20, 10, 5, 2.5, 1.25, 0.61, 0.32 and 0.15 nm for C3. The ka, kd, and KD values are given as their average fitted from three independent concentration series ± the standard deviation. C, competition SPR assay with 50 nm C3b preincubated with 500 nm of different hC3Nb1 mutants. D, competition SPR assay with 50 nm C3b preincubated with 500 nm FB or FH. In C the curve for hC3Nb1(W102A) is hidden below the C3b curve. RU, response units.

