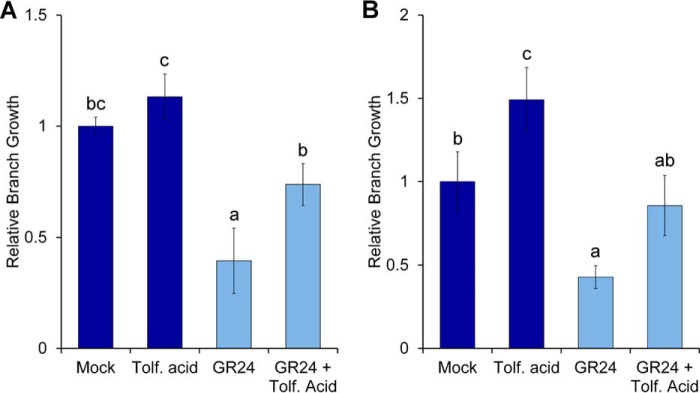
Figure 8.
In vivo activity of tolfenamic acid. A, bud growth assay of petunia plants decapitated after leaf 2, treated with 0.5 μm GR24 and/or 50 μm tolfenamic acid. The numbers of leaves produced at the two leaf axils for each treatment were normalized relative to the mock-treated control (n = 10–11; data shown are mean ± S.E. (error bars)). B, bud growth assay of Arabidopsis two-node stem segments, treated with 0.5 μm GR24 and/or 5 μm tolfenamic acid. Total bud lengths for the two nodes were normalized relative to the mock-treated control (n = 16; data shown are mean ± S.E.). Statistical tests of differences between treatments were calculated by analysis of variance and Fisher's protected LSD multiple comparisons test (p = 0.05).

