Figure 1.
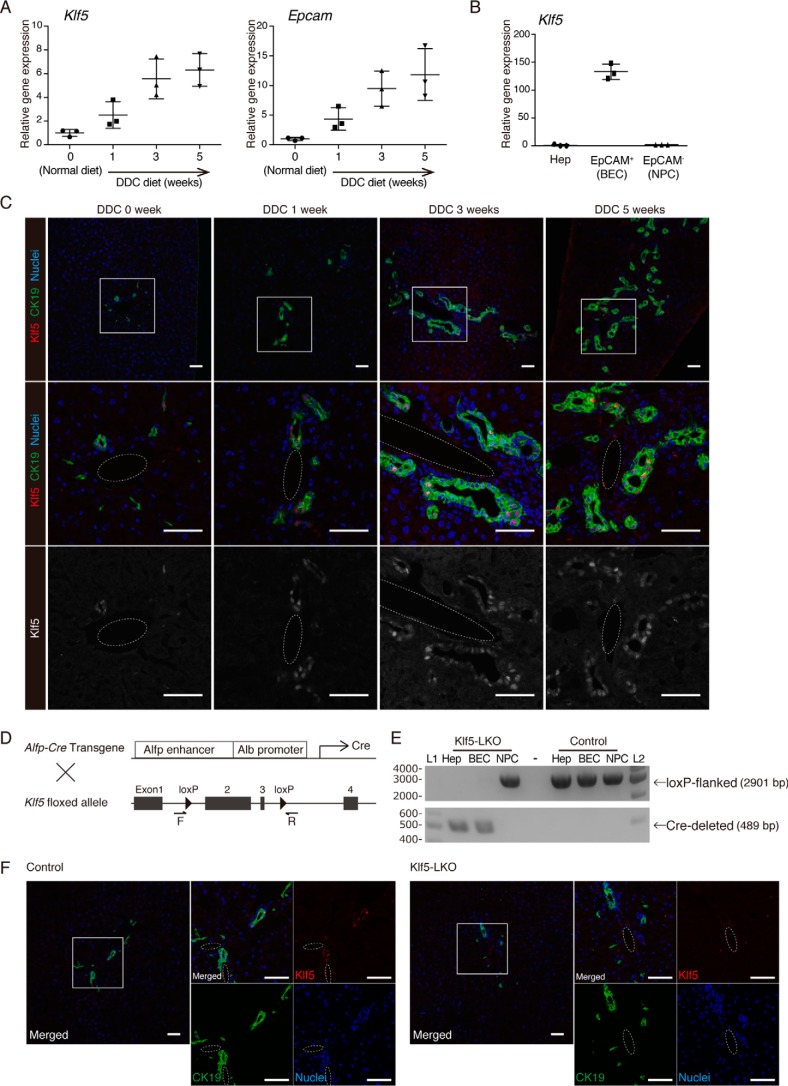
Expression pattern of Klf5 in the mouse liver. A, expression levels of Klf5 and Epcam in whole-liver mRNA samples prepared from WT mice were determined by quantitative RT-PCR. B, expression of Klf5 in liver cell fractions. Hepatocytes (Hep), EpCAM+ BEC fraction, and EpCAM− NPC fractions were collected from livers of WT mice upon DDC administration for 3 weeks and analyzed by quantitative RT-PCR. C, immunostaining for Klf5 (red in the upper and center panels; gray scale in the lower panels) and CK19 (green) in the WT mouse liver. Counterstaining for nuclei is shown in blue (upper and center panels). Regions indicated by white boxes in the upper panels are magnified in the middle and lower panels. Dashed lines show portal veins. Scale bar, 50 μm. D, scheme for production of Klf5-LKO mice. F and R denote the positions of primers used for genomic PCR analyses shown in E and Fig. 4B. E, genomic PCR analysis for Cre-mediated recombination in the Klf5 locus. The upper and lower panels show amplicons corresponding to nonrecombined (floxed) and recombined (Cre-deleted) alleles, respectively. Lanes L1 and L2 were loaded with 100-bp ladder and 1-kb ladder DNA size markers, respectively. The sizes of markers (bp) are indicated to the left. F, loss of Klf5 expression in the Klf5-LKO mouse liver was confirmed at the protein level. Immunostaining results for Klf5 (red) and CK19 (green) are shown with counterstaining for nuclei (blue). Regions indicated by white boxes in the left panels are magnified in the right panels together with single color channel images. Dashed lines show portal veins. Scale bar, 50 μm.

