Figure 3.
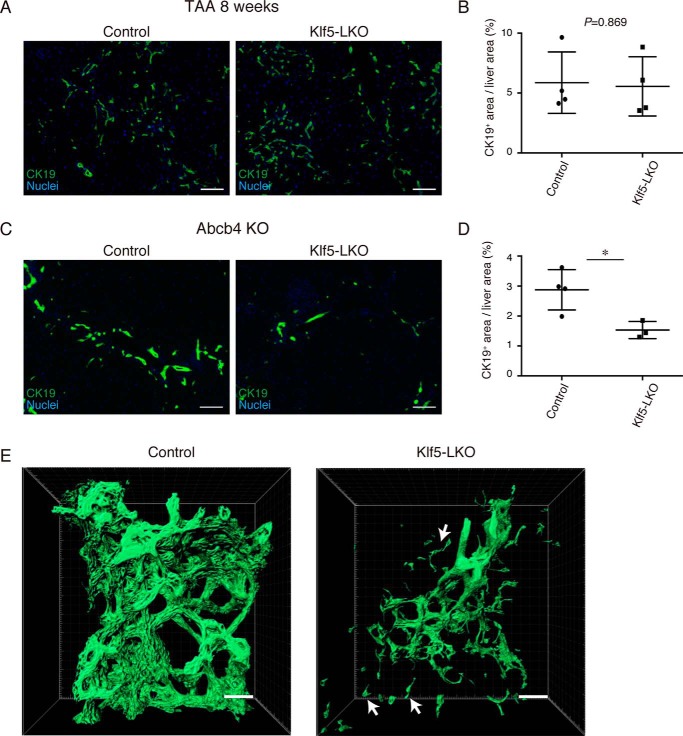
Loss of Klf5 affects DR induction specifically under cholestatic liver injury conditions. A, representative images of immunostaining for CK19 (green) in the Klf5-LKO and control livers treated with TAA for 8 weeks. Counterstaining for nuclei is also included (blue). Scale bar, 100 μm. B, quantification of CK19+ areas in whole-liver sections prepared from the TAA-treated mice as in A. n = 4 mice for each group. p values were calculated by Student's t test. C, representative images of immunostaining for CK19 (green) in the Abcb4 KO and Klf5-LKO double knockout and control (Abcb4 single knockout) livers at 8 weeks after birth. Counterstaining for nuclei is also shown (blue). Scale bar, 100 μm. D, quantification of CK19+ areas in whole-liver sections prepared from the Abcb4 KO cohorts as in C. n = 4 and 3 mice for the control (Abcb4 single knockout) and the Klf5-LKO (Abcb4 KO; Klf5-LKO double knockout) groups, respectively. p values were calculated by Student's t test. p values = 0.0209. E, 3D immunostaining for CK19 (green) in the Abcb4 KO and Klf5-LKO double knockout and control (Abcb4 single knockout) livers at 8 weeks after birth. Stacked images were obtained with confocal microscopy and used to reconstruct a 3D image using the IMARIS software. The image is shown in surface mode. White arrows indicate CK19+ cells separated from the biliary tree structure. Scale bar, 50 μm. Asterisks indicate that the p values are <0.05 (*, p < 0.06).

