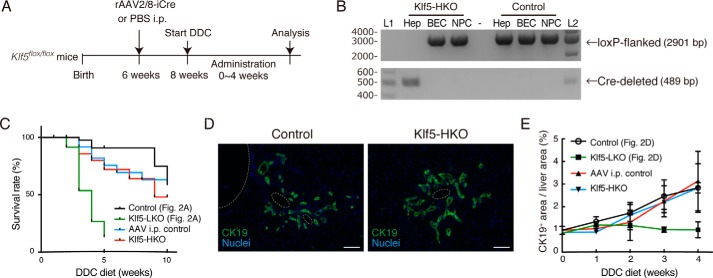
Figure 4.
Deletion of Klf5 in hepatocytes does not affect DR induction. A, experimental scheme for analyses on the effect of hepatocyte-specific loss of Klf5. B, genomic PCR analysis for Cre-mediated recombination in the Klf5 locus using primers shown in Fig. 1D. The upper and lower panels show amplicons corresponding to nonrecombined (floxed) and recombined (Cre-deleted) alleles, respectively. Lanes L1 and L2 were loaded with 100-bp ladder and 1-kb ladder DNA size markers, respectively. The sizes of markers (bp) are indicated to the left. C, Kaplan-Meier survival curves of Klf5-HKO (n = 30) and AAV i.p. control (n = 27) mice treated with DDC. For comparison, the survival curves of Klf5-LKO and the control mice shown in Fig. 2A are also overlaid. D, immunostaining for CK19 (green) in the Klf5-HKO and control livers treated with DDC for 4 weeks shown with counterstaining for nuclei (blue). Scale bar, 100 μm. E, quantification of CK19+ areas in whole-liver sections prepared from Klf5-HKO and AAV i.p. control mice. For comparison, the data of Klf5-LKO and the control mice shown in Fig. 2D are also overlaid. Data represent mean ± S.D. n ≥ 3 mice for each time point. p values were calculated by Mann-Whitney U test for each time point comparing the Klf5-HKO and control mice and are as follows: 0.100 (DDC 0 week); 0.100 (DDC 1 week); 0.400 (DDC 2 weeks); 0.900 (DDC 3 weeks); and 0.857 (DDC 4 weeks).

