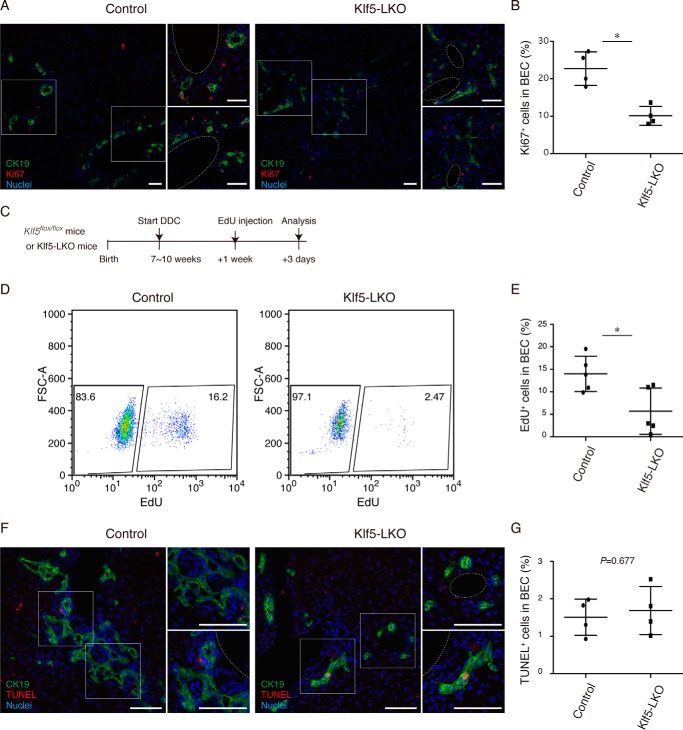
Figure 6.
BEC proliferation upon DDC-induced liver injury is suppressed in Klf5-LKO mice. A, immunostaining for Ki67 (red) and CK19 (green) in the Klf5-LKO and control livers treated with DDC for 1 week shown with counterstaining for nuclei (blue). Two regions of interest indicated by white boxes in the left panels are magnified in the right panels. Scale bar, 50 μm. B, quantification of Ki67+ cells in the CK19+ BEC population. n = 4 mice. p value was calculated by Student's t test to be 0.00520. C, experimental scheme of in vivo EdU incorporation assays. D, flow cytometry analysis of EdU incorporation in BECs in Klf5-LKO and control mice upon DDC injury. Representative dot plots for the BEC population (EpCAM+ CD45− cell fraction) gated out from NPCs are shown. E, quantification of EdU+ cells in BECs as revealed by flow cytometry analyses. n = 5 mice. p value was calculated by Student's t test to be 0.0224. F, TUNEL staining (red) was performed to detect apoptotic cells with co-immunostaining for CK19 (green) in the Klf5-LKO and control livers treated with DDC for 2 weeks. Counterstaining for nuclei is also shown (blue). Scale bar, 50 μm. G, quantification of TUNEL+ cells in the CK19+ BEC population. n = 4 mice. p value calculated by Student's t test. Asterisks indicate that the p values are <0.05 (*, p < 0.06).

