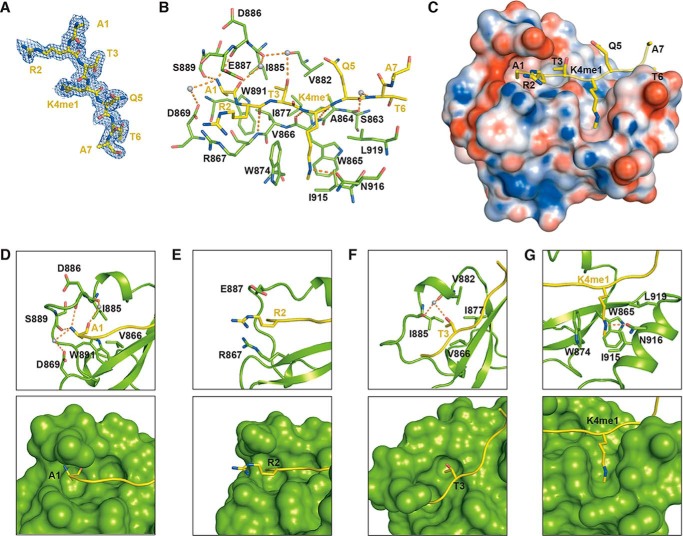
Figure 2.
Interactions of SDG8-CW and H3K4me1 peptide. A, 2Fo − Fc electron density map (contoured at 0.5 σ cutoff; blue mesh) of H3K4me1 peptide. B, details of intermolecular interactions between SDG8-CW and H3K4me1 peptide. Residues are shown as sticks, and water molecules are shown as gray spheres. Hydrogen bonds are indicated as orange dashes. C, electrostatic potential of the surface of SDG8-CW, calculated by the PDB2PQR server with H3K4me1 binding on the concave surface (60). D–G, detailed interactions between N-terminal-residues ARTK of H3K4me1 and SDG8-CW. Residues in sticks are shown in the top panel, and surface structures are shown in the bottom panel.

