Fig. 1.

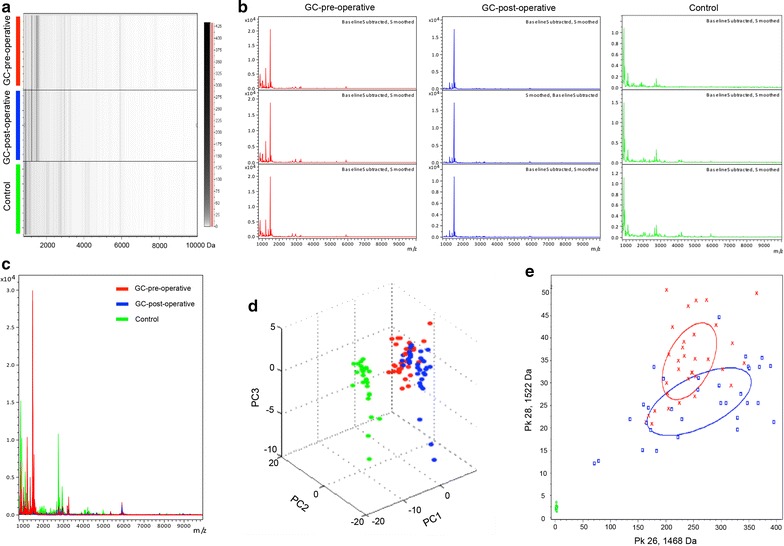
Reproducibility of mass spectra generated in individuals from different groups and the comparative analysis of serum proteomic profiling between different groups. a Gel view of mass spectra from healthy control (green), GC pre-operative (red) and GC post-operative (blue) serum samples, in the mass range from 1000 to 10000 Da. b Representative mass spectra of three samples in each group in the mass range from 1000 to 10,000 Da, showing high reproducibility and stability between replicates. c Overall sum of the spectra in the mass range from 1000 to 10,000 Da obtained from all GC patients pre-operation (red) and post-operation (blue), as well as healthy controls (green). d 3D plot and bivariate plot e of pre-operative GC patients (red), healthy controls (green), and post-operative GC patients (blue) in the PCA
