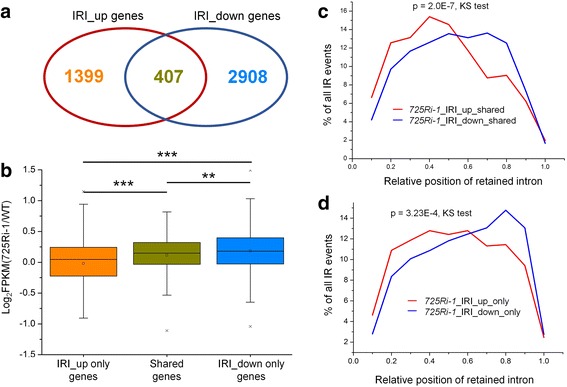
Fig. 2.

Characterization of genes with changed IR events between 725Ri-1 and WT rice. a The Venn diagram denotes the relationship between genes with up- and down-regulated IR events. b Box plot of gene expression differences between 725Ri-1 and wild-type (WT) rice for the three types of genes. ** and *** indicate p values < 0.01 and < 0.001, respectively (t test). c, d Distribution of up- (red) and down-regulated (blue) IR events in the 407 genes with both intron retention index (IRI)-up and IRI-down introns (c) or in genes with only IRI-up or IRI-down introns (d). A twofold change in IRI was applied as a cutoff to define up- or down-regulation
