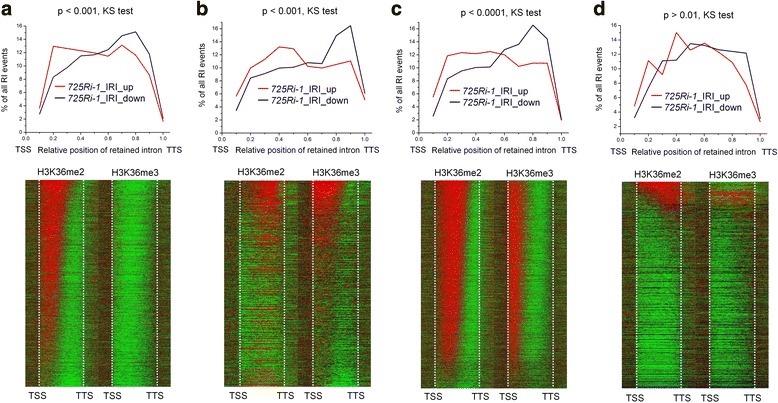
Fig. 4.

H3K36me2 and H3K36me3 contribute to the global shift of intron retention. Distribution of up- (red) and down-regulated (blue) retained intron (RI, twofold) in genes with a shifted H3K36me2 profile (a), a shifted H3K36me3 profile (b), both (c), or neither (d). IR distributions and heatmaps of H3K36 methylations are shown in the top and bottom panels, respectively. Each line of a heatmap represents a gene, and the tag counts in the gene body were divided into 300 bins. Increased and decreased ChIP-seq signals (725Ri-1 vs. WT) are shown in red and green, respectively. Genes are sorted in descending order based on the number of red bins in the gene body. See Methods for details of how to define H3K36me2/me3 shifted genes
