Fig. 1.

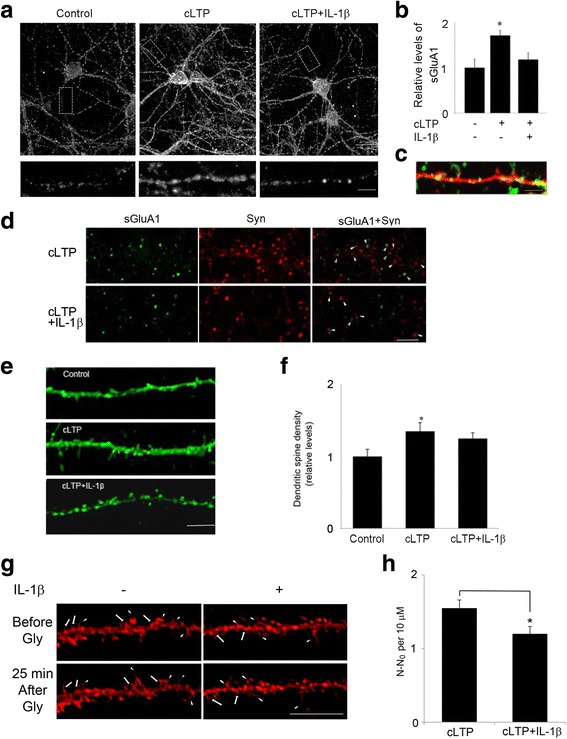
IL-1β impaired cLTP-induced GluA1 insertion and spine formation. a Representative fluorescence images show the expression of surface GluA1 (sGluA1) in unstimulated control cells and cells treated with cLTP in the presence or absence of IL-1β. cLTP was induced in hippocampal neurons at 14–18 DIV. sGluA1 level was assessed by immunocytochemistry as described in the “Methods” section. Scale bar: top panel, 10 μm; bottom panel, 5 μm. b Quantification of the images shown in a. Data are mean ± SEM from three independent experiments expressed in terms of control (*p < 0.05, ANOVA). c GluA1 (green) insertion occurs primarily in spines, identified in neurons transfected with TdTomato (red). Scale bar, 5 μm. d Cells double-labeled with GluA1, under nonpermeant conditions, and synaptophysin (Syn), under permeant conditions. The co-localization of GluA1 and Syn was illustrated by the arrowhead. Scale bar, 10 μm. e IL-1β decreased cLTP-induced growth of dendritic spines. Representative fluorescence images of hippocampal dendritic spines visualized in cells transfected with Lifeact-GFP. Thirty minutes min after cLTP, cells were fixed and image was taken and spine density was quantified. cLTP increased the density of dendritic spines. Scale bar, 10 μm. f Quantification of dendritic spine density. Data are mean ± SEM from three independent experiments expressed in terms of spine numbers obtained in the control cultures (*p < 0.05, ANOVA). g Glycine stimulation induces new spine formation (arrow) and preexisting spine growth (arrow head). Neurons expressing Lifeact-mCherry were stimulated by glycine (200 μM, 10 min) and then imaged at the indicated time after glycine stimulation. Scale bar, 20 μm. h Quantitative of spine formation following glycine stimulation. N number of dendritic protrusions per 10 μm at 25 min after glycine stimulation, N0 number of dendritic protrusions per 10 μm before glycine stimulation. Data are mean ± SEM (n = 4) (*p < 0.05, Student’s t test)
