Fig. 2.

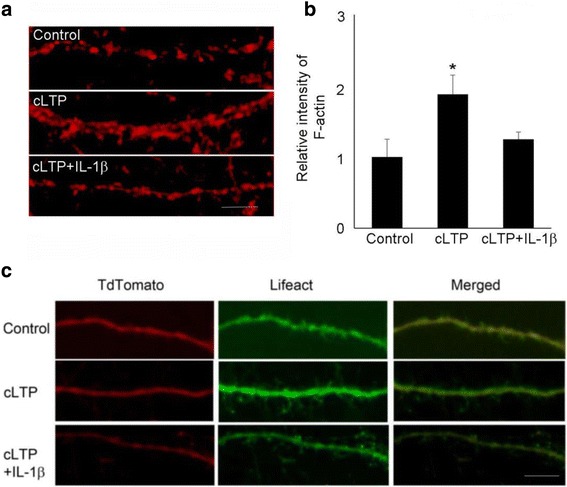
IL-1β impaired cLTP-induced actin polymerization. a Cells were fixed following cLTP (30 min) and F-actin staining by phallodin. Scale bar, 5 μm. b Quantification of the images shown in a. Data are mean ± SEM from three independent experiments expressed in terms of control (*p < 0.05, ANOVA). c F-actin in control and cLTP-stimulated cells were labeled by Lifeact/tdtomato co-transfection. Scale bar, 5 μm
