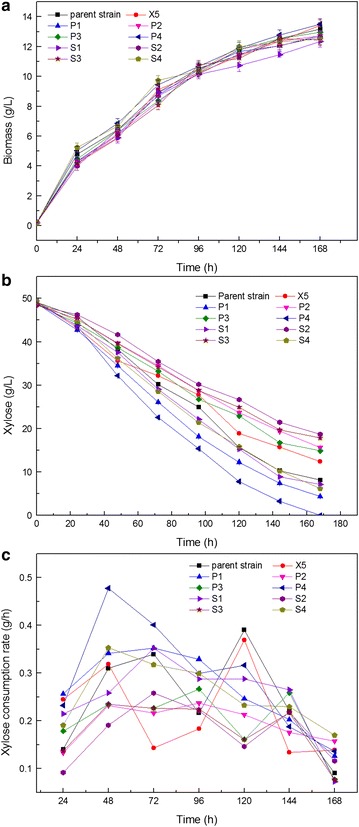
Fig. 2.

Comparison of cell growth (a), xylose utilization (b), and xylose consumption rate (c) of the recombinant A. pullulans with that of the parent strain. Data are given as mean ± standard error value of each group (p < 0.05)

Comparison of cell growth (a), xylose utilization (b), and xylose consumption rate (c) of the recombinant A. pullulans with that of the parent strain. Data are given as mean ± standard error value of each group (p < 0.05)