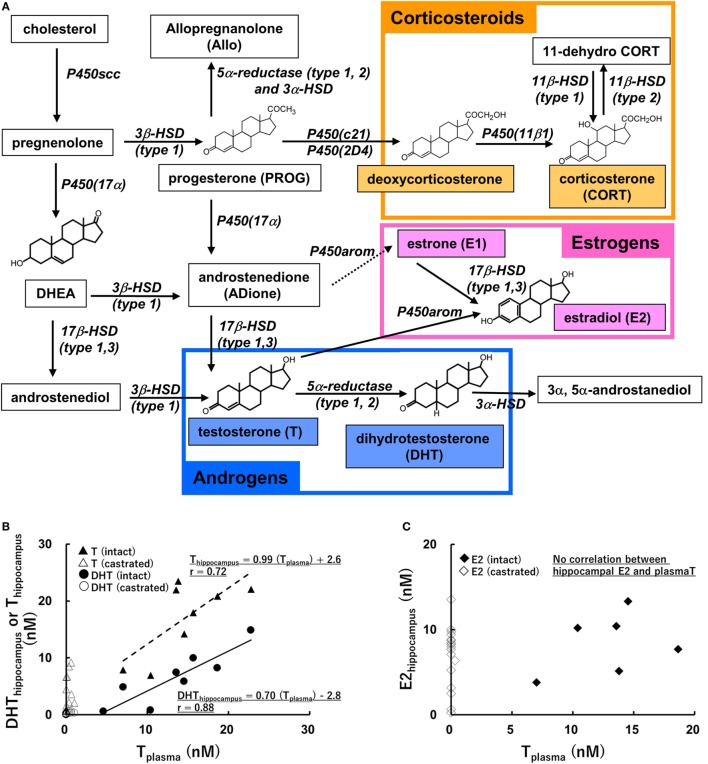
Figure 1.
(A) Biosynthetic pathway of steroids in rat hippocampus [modified from Ref. (11)]. Estrogens, androgens, and corticosteroids are represented with pink, blue, and orange boxes, respectively. (B,C) Relationship between the level of plasma T and those of hippocampal androgens [T and dihydrotestosteron (DHT)] (A), or that of hippocampal E2 (B). Vertical axis represents hippocampal steroids and horizontal axis represents plasma T, a precursor of DHT and E2. The regression lines and Pearson’s “r” are indicated [modified from Ref. (37)].

