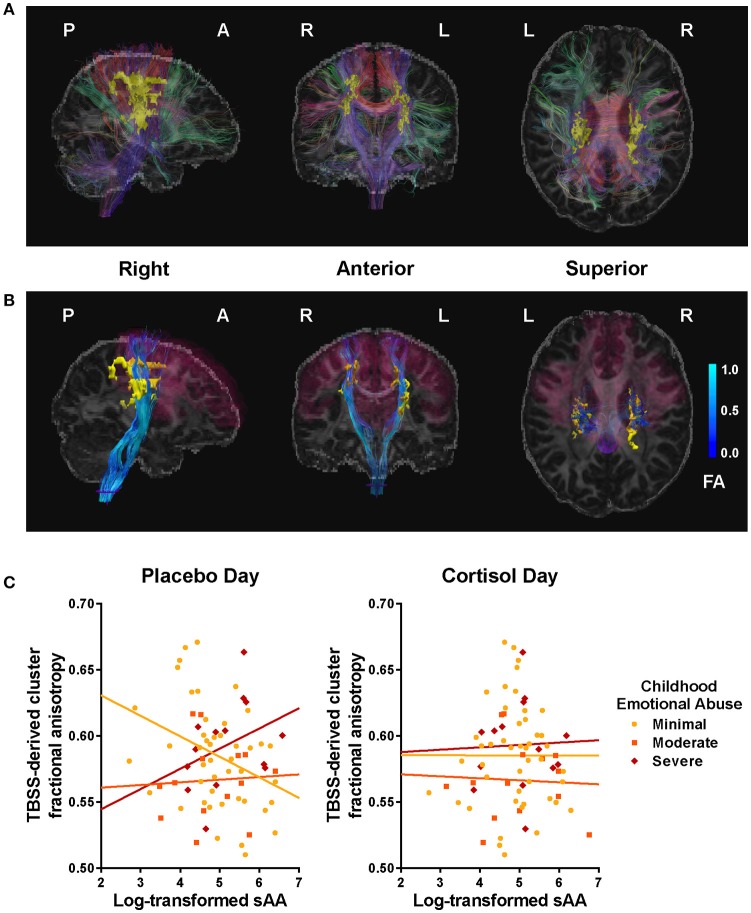
Figure 3.
Clusters and tracts in which the relation between fractional anisotropy (FA) and salivary alpha-amylase (sAA) was moderated by childhood emotional abuse (EA). (A) Tract-based spatial statistics (TBSS)-derived clusters (yellow) significantly associated with EA × sAACORT−Placebo interaction, illustrated with a representative participant, and fiber tracts intersecting clusters (color indicates direction at fiber midpoint: red fibers run primarily left-right, green anterior-posterior, blue superior-inferior). See Table 3 for listing of significant clusters. (B) Projection fibers (blue) originating from corticomotor regions (magenta, derived from FreeSurfer segmentation: precentral gyrus, paracentral gyrus, posterior & caudal anterior cingulate gyrus & sulcus, superior frontal gyrus, and caudal middle frontal gyrus), passing through TBSS-derived cluster (yellow), and reaching spinal cord (purple) after virtual dissection using FreeSurfer segmentation. Brighter blue indicates higher FA. (C) Scatter plots for sAA and cluster FA, plotted by EA. At left, Placebo-day correlations; at right, CORT-day correlations. EA moderated the association between cluster FA and sAA levels during placebo administration but not during CORT, F(6,74) = 3.90, p < 0.01.

