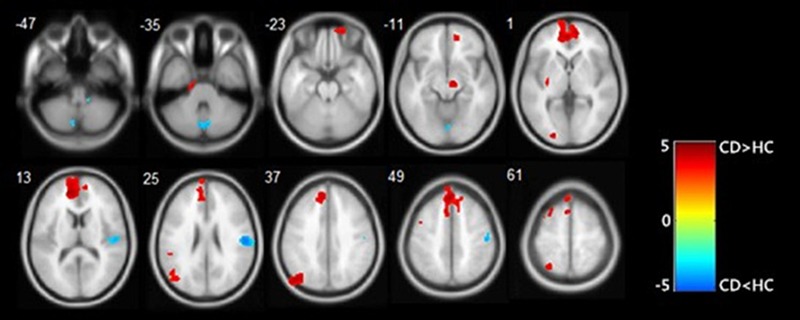
FIGURE 2.

Results of VBM analysis presented at p < 0.001 and an extent threshold of 50 adjacent voxels. CD groups presented some regions with increased gray matter volume (in red) and some with decreased gray matter volume (in blue). Colors symbolize T scores (see color bar).
