Table 4.
Percentage Distributions of Demographic and Risk Factors Among Controls and Women Biopsied on Suspicion of Breast Cancer in the Ghana Breast Health Study
| Study Characteristics | Controls (N=2,161) |
Malignancies (N=1,201) |
Benign Conditions (N=792) |
Indeterminate Pathology (N=209) |
|---|---|---|---|---|
| Age (years) | ||||
| < 35 | 20.5 | 9.7 | 41.9 | 27.3 |
| 35-44 | 26.9 | 24.5 | 26.8 | 24.4 |
| 45-54 | 26.1 | 30.0 | 18.7 | 23.0 |
| ≥ 55 | 26.1 | 35.6 | 12.4 | 25.4 |
| Unknown | 0.5 | 0.3 | 0.3 | 0.0 |
| Medians | 45 | 49 | 38 | 44 |
| Education | ||||
| No formal education | 23.9 | 22.7 | 12.2 | 12.4 |
| Primary school | 17.4 | 13.7 | 7.8 | 11.0 |
| Junior secondary school | 30.7 | 23.5 | 23.7 | 26.3 |
| ≥ Senior secondary school | 24.6 | 33.3 | 52.9 | 44.0 |
| Unknown | 3.4 | 6.7 | 3.3 | 6.2 |
| Family history of breast cancer | ||||
| No | 96.7 | 91.8 | 91.2 | 91.4 |
| Yes | 2.2 | 7.0 | 7.4 | 7.7 |
| Unknown | 1.1 | 1.2 | 1.4 | 1.0 |
| Parity | ||||
| Nulliparous | 10.7 | 9.2 | 30.3 | 23.4 |
| 1-2 | 26.1 | 28.5 | 30.6 | 29.2 |
| 3-4 | 32.3 | 32.6 | 24.6 | 26.8 |
| ≥ 5 | 30.4 | 29.2 | 14.3 | 20.1 |
| Unknown | 0.4 | 0.4 | 0.3 | 0.5 |
| Age at menarche (years) | ||||
| < 15 | 27.9 | 23.8 | 38.3 | 32.1 |
| 15 | 25.7 | 22.4 | 24.0 | 21.1 |
| 16 | 18.0 | 19.7 | 16.9 | 16.7 |
| ≥ 17 | 18.5 | 20.6 | 13.8 | 18.2 |
| Unknown | 9.9 | 13.4 | 7.1 | 12.0 |
| Age at menopause (years) | ||||
| Premenopausal | 57.6 | 42.2 | 75.8 | 61.7 |
| < 45 | 7.9 | 11.4 | 6.8 | 8.6 |
| 45-49 | 12.4 | 16.4 | 6.8 | 9.1 |
| 50-54 | 13.7 | 18.2 | 7.2 | 12.9 |
| ≥ 55 | 3.2 | 5.1 | 1.0 | 1.4 |
| Unknown | 5.2 | 6.7 | 2.4 | 6.2 |
| Body size1 | ||||
| Slight | 27.3 | 22.7 | 36.0 | 28.2 |
| Average | 39.8 | 38.2 | 38.6 | 39.2 |
| Slightly heavy | 22.5 | 22.8 | 17.4 | 18.7 |
| Very heavy | 7.6 | 9.3 | 4.5 | 6.2 |
| Unknown | 2.8 | 6.9 | 3.4 | 7.7 |
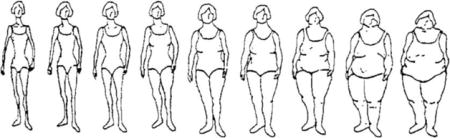
1
Body shapes classified according to 9-scale pictograms, with 1 corresponding to the slimmest figure and 9 to the heaviest figure. For purposes of this analysis pictograms were classified as follows: Slight = 1 and 2, average = 3 and 4, slightly heavy = 5 and 6, and heavy = 7, 8 and 9.