Fig. 1.

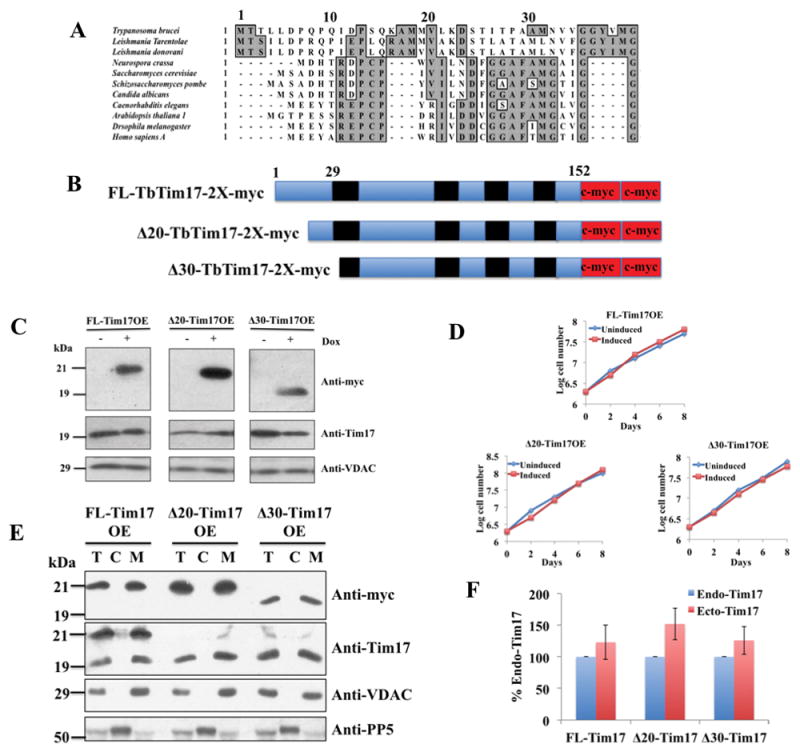
Sequence alignment of the N-terminal region of Tim17 in different organisms, schematics, expression, and sub-cellular localization of the N-terminal deletion mutants of TbTim17. (A) Primary sequence alignment of Tim17 N-terminal region in different organisms. Conserved residues are in grey boxes. (B) Schematics of the FL-, Δ20- and Δ30-TbTim17-2X-myc proteins. The predicted transmembrane domains are in black and myc epitope tags are in red. Numbers indicate the position of the amino acid residues. (C) Inducible expression of FL-, Δ20-, and Δ30-Tim17-2X-myc in T. brucei. Stable transfectants for FL-Tim17OE (over expressed), Δ20-Tim17OE, and Δ30-Tim17OE were grown in the absence (−) and presence (+) of doxycycline (Dox) for 48 hours. Equal numbers of cells were harvested and total cellular proteins were analyzed by SDS-PAGE and immunoblot analysis using anti-myc, -TbTim17, and –VDAC antibodies. 5 × 10⁶ cells were loaded per lane (D) Growth kinetics of FL-Tim17OE, Δ20-Tim17OE, and Δ30-Tim17OE in the absence (uninduced) and presence (induced) of doxycycline. Cells were counted up to 8 days and the log of cumulative cell numbers was plotted against time. (E) The FL-Tim17OE, Δ20-Tim17OE, and Δ30-Tim17OE cells were grown in the presence of doxycycline for 48 h. Cells were harvested and sub-cellular fractionation were performed. Total (lane T), Cytosolic (lane C), and mitochondrial (lane M) fractions were analyzed by SDS-PAGE and immunoblotting using anti-myc, -Tim17, -VDAC, and -PP5 antibodies. (F) The intensity of protein bands for the endogenous (Endo) Tim17 (recognized by anti-Tim17 antibody) and the ectopically (Ecto) expressed FL and N-terminal deletion mutants (recognized by anti-myc antibody) in the mitochondrial fractions were quantitated by densitometry, normalized with the levels of VDAC in the corresponding samples. Levels of ectopically expressed proteins are presented as percent of the endogenous TbTim17 levels in the corresponding cell lines. Standard errors were calculated from 3 independent experiments.
