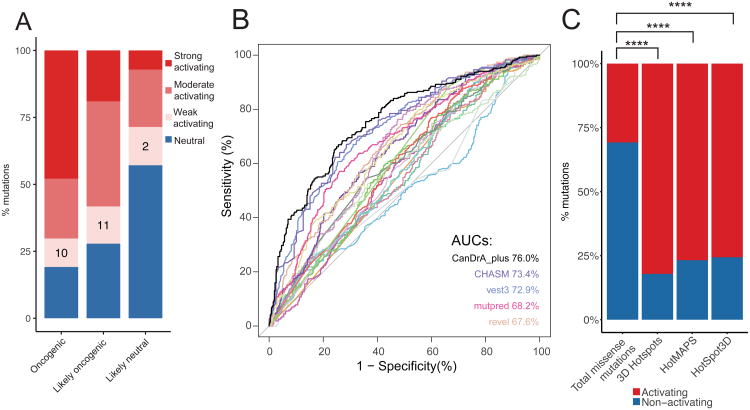
Figure 3. Comparison of our functional annotation with literature data and computational predictions.
(A) Activating and neutral mutations from our (non-pooled) in vitro platform results were compared to oncogenic, likely oncogenic, and likely neutral mutations annotated from OncoKB. The percentage of mutations in each category is shown. Activating mutations were further classified into strong, moderate and weak based on the degree of activating comparing with the corresponding wild-type genes. Numbers on the bars indicate the mutation numbers in each group. (B) ROC curves of 21 commonly used computational algorithms based on the functional calls in this study, with AUC scores for the top 5 algorithms. (C) Enrichment of activating mutations in three 3D computational algorithms. Numbers on the bars indicate the mutation numbers in each group. ****, p < 10-5. See Figure also S3 and Table S3.

