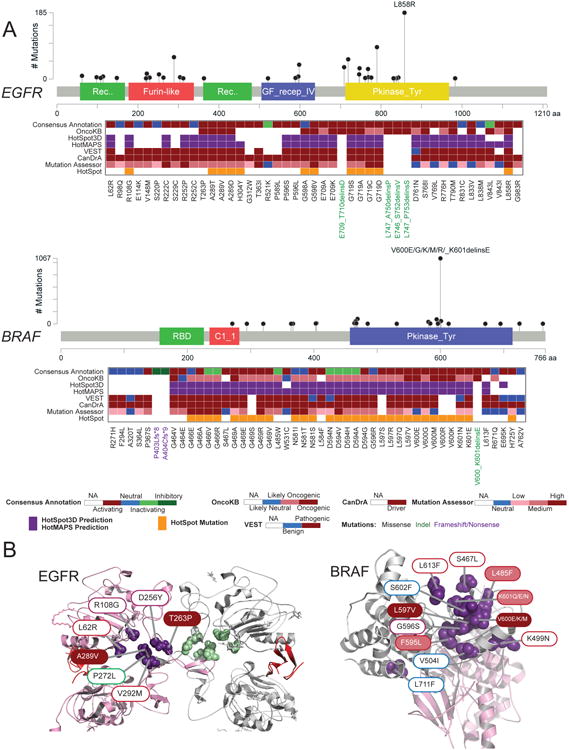
Figure 5. Analysis of EGFR and BRAF mutation allelic series.

(A) Functional annotations of EGFR (top) and BRAF (bottom) allelic series. Only recurrent mutations of the series are shown. The frequency (based on TCGA and GENIE databases) and location of mutations tested are shown in lollipop plots. In the heatmap (from top to bottom), the consensus functional annotation, OncoKB annotation, computational prediction by 3D structural cluster (HotSpot3D, HotMAPs), population-based (VEST) cancer-focus (CanDrA), Mutation Assessor and hotspot predictions (based on Chang et al., 2016) of mutations tested in this study are shown. (B) Structural clusters of activating mutations in EGFR (left) and BRAF (right). Filled color and border color of the mutation label indicate the OncoKB annotation and our consensus functional annotation, respectively. See also Figure S5.
