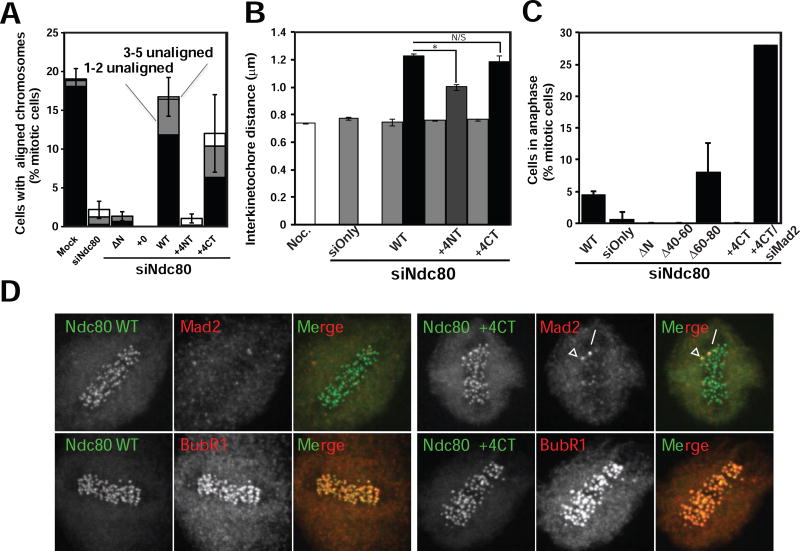
Figure 4. Ndc80+4CT tail mutant metaphase arrest does not satisfy spindle assembly checkpoint and is Aurora dependent.
(A) Graph representing chromosome alignment among mitotic cells expressing Ndc80 mutants. Mitotic cells were scored for chromosome alignment into a metaphase plate, and the percentage of metaphase cells was plotted. Metaphase cells were further subdivided to indicate cells with all chromosomes aligned (black), cells with 1–2 unaligned chromosomes (gray) and cells with 3–5 unaligned chromosomes (white). Mitotic cells with 6 or more unaligned chromosomes are not shown in the graph. N > 100 mitotic cells counted per experiment, N = 3. Data is represented as mean ± SD (SD represents total of cells with 0–5 unaligned chromosomes).
(B) Graph representing interkinetochore distance measurements in cells expressing Ndc80 mutants. Ten sister kinetochores in at least five cells (N > 50) were identified by ACA staining between Ndc80 signals, and the distance between those sister kinetochores was measured (N=3). The distance (mean ± SD) is plotted for early prometaphase (EPM) (gray), late prometaphase (LPM) (dark gray), and metaphase (black) cells, Noc = nocodazole-treated cells (white). * - p < 0.0002. N/S - p > 0.2. (Student’s t-test)
(C) The percentage of mitotic cells in anaphase was plotted for Ndc80WT, Ndc80 knockdown and indicated Ndc80 tail mutant cells (mean ± SD). For the Ndc80+4CT mutant, cells were also co-transfected with siRNA targeting Mad2. For Ndc80 tail mutants, one hundred mitotic cells counted per experiment (n = 3). For Mad2 co-transfection with Ndc80+4CT, twenty-five cells were counted.
(D) Immunofluorescence staining of Ndc80WT and Ndc80+4CT (green) stable lines after depletion of endogenous Ndc80. Ndc80+4CT cells arrest with at least one Mad2 positive kinetochore (red, upper row) with no loss of BubR1 localization (red, lower row). Scale bar = 5 µm.

