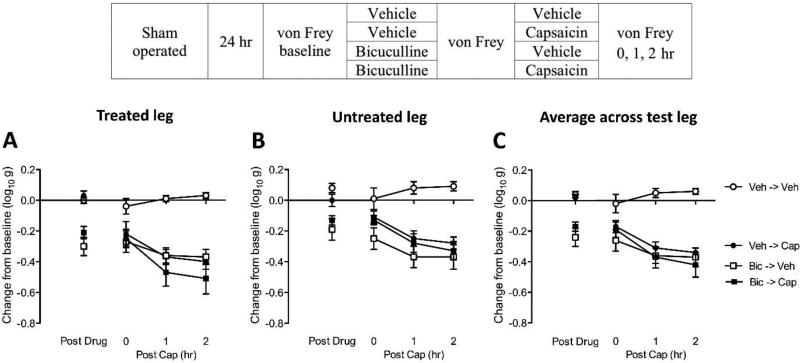
Fig. 7. Bicuculline enhances nociceptive reactivity, and fails to block capsaicin induced EMR, in sham-operated rats.
The experimental design is illustrated at the top of the figure. Subjects that received bicuculline (Bic) and vehicle (Veh) are depicted as squares and circles, respectively. Groups treated with capsaicin (Cap) or its vehicle (Veh) are shown in black and white, respectively. (A) The y-axis depicts the change from baseline scores for the capsaicin-treated leg after bicuculline (Post Drug), and 0, 1, 2, 3 hr after capsaicin (Post Cap), treatment. (B) The change from baseline scores for the untreated leg. (C) The change from baseline scores averaged over test leg. The error bars depict ± SEM.

