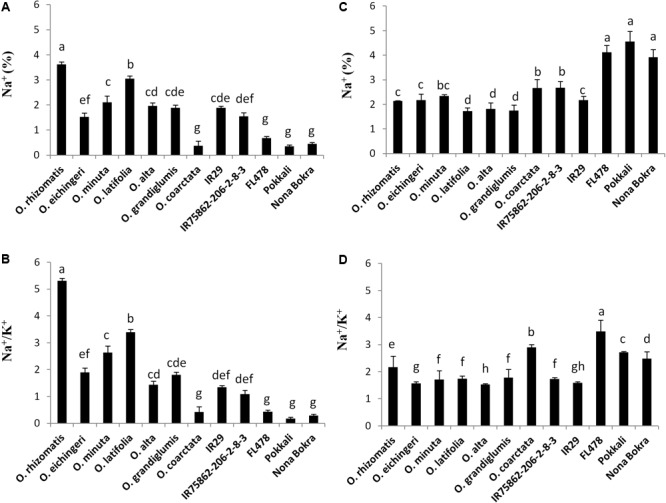
FIGURE 4.

Na+ content (%) and Na+/K+ ratio in shoot (A,B) and root (C,D), respectively, in the tolerant wild species and the cultivated checks after 10 days of 180 mM NaCl treatment. Mean values were obtained from five plants. Vertical bars indicates ±SE. Different letters in error bars are statistically different as inferred from DMRT at p < 0.05.
