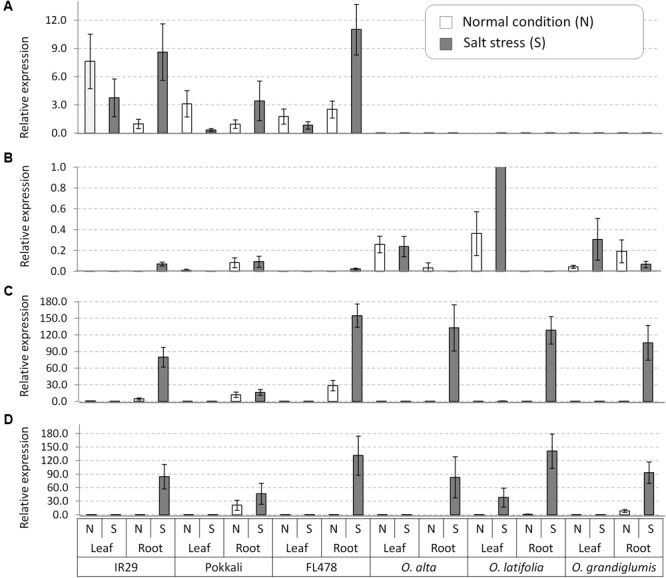
FIGURE 5.

Gene expression analyses of the salt tolerance genes in leaf and root tissues collected from the salt tolerant wild species having the CCDD genomes and the checks varieties. (A) OsNHX1, (B) OsHKT1;4, (C) OsHKT1;5, and (D) OsSOS1. OsActil1 was used as an internal control of qRT-PCR. N, normal nutrition solution (white bar); S, salt stress (gray bar). Error bar means SD (n = 3).
