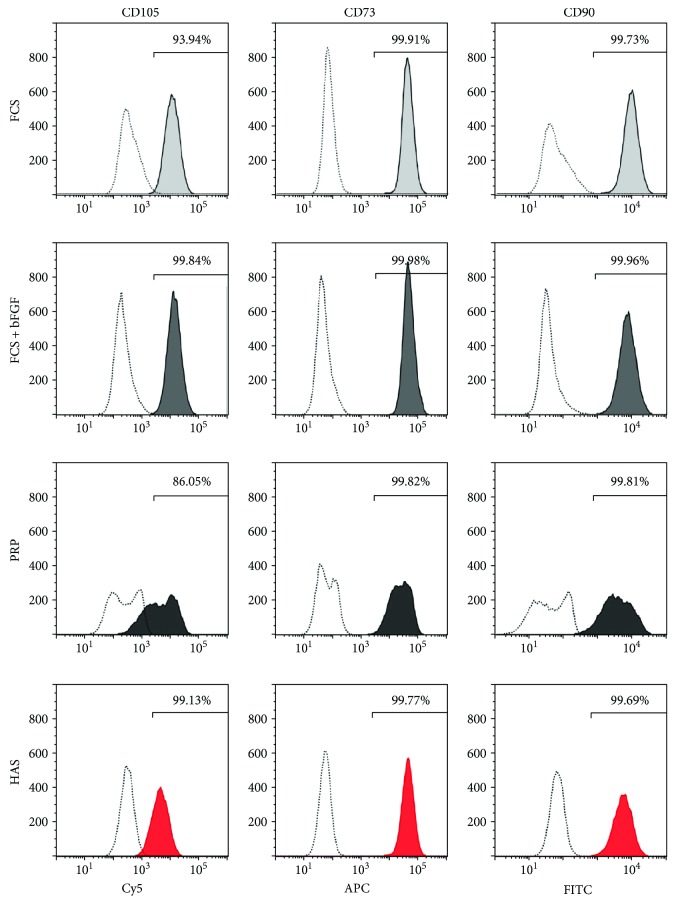
Figure 3.
Cell immunophenotypes of MSCs cultured in differently supplemented media. MSCs were cultured in FCS (light-gray shading), FCS + bFGF (dark-gray shading), PRP (black shading), or HAS (red shading); stained with specific antibodies; and analyzed with flow cytometry. Unstained control cells are represented by dotted lines. Representative images of MSC and hematopoietic marker expression.

