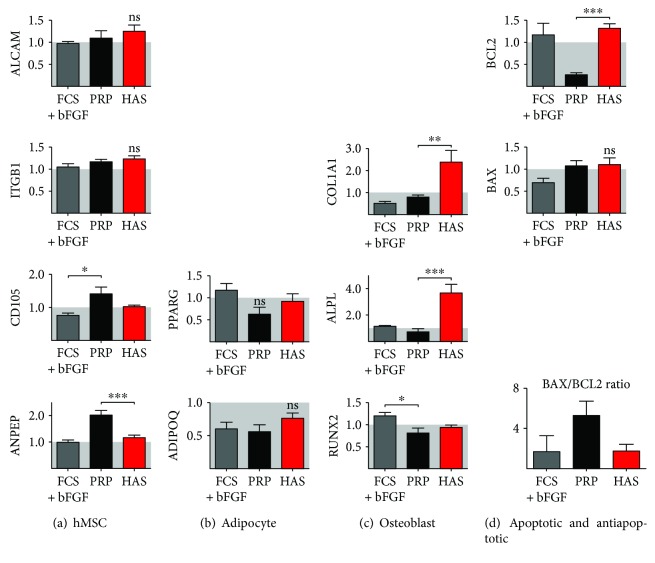
Figure 4.
Gene expression analysis of MSCs cultured in serum-supplemented media. Following 5 days' culture in FCS + bFGF (gray bar), PRP (black bar), or HAS (red bar) and FCS as control, mRNA was isolated for RT-qPCR analysis of MSC- (a), adipocyte- (b), osteoblast- (c), apoptosis-, and antiapoptosis-specific (d) genes. Data are presented as fold change values to the expression of MSCs cultured in FCS-supplemented medium that was considered as the standard growth medium. ∗Confidence interval P-value 0.05 to 0.01, significant; ∗∗ P-value 0.001 to 0.01, very significant; ∗∗∗ P-value 0.0001 to 0.001, extremely significant.

