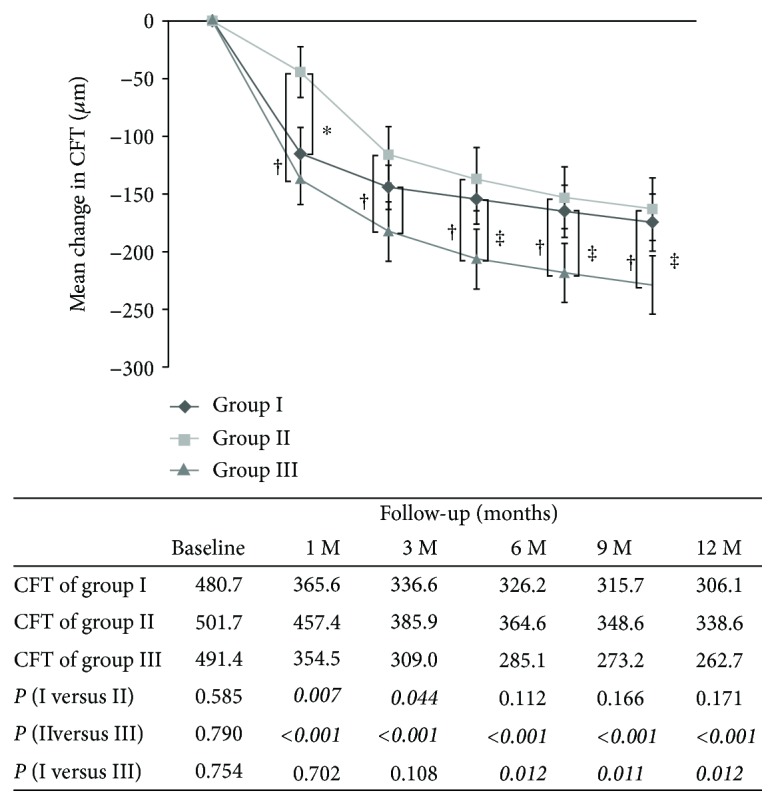
Figure 3.

Temporal change of central foveal thickness (CFT) postoperatively. The reduction in CFT differed significantly between group I and group II during the first month after surgery. The reduction in CFT differed significantly between group II and group III at 1, 3, 6, 9, and 12 months of follow-up. The table below the graph shows the absolute values of the mean CFT for each follow-up visit (group I: ERM removal without ILM peeling; group II: ERM removal and whole-piece ILM peeling; group III: ERM removal and maculorrhexis ILM peeling; ∗ indicates p < 0.05 compared between group I and group II at each follow-up visit; † indicates p < 0.05 compared between group II and group III at each follow-up visit; ‡ indicates p < 0.05 compared between group I and group III at each follow-up visit).
