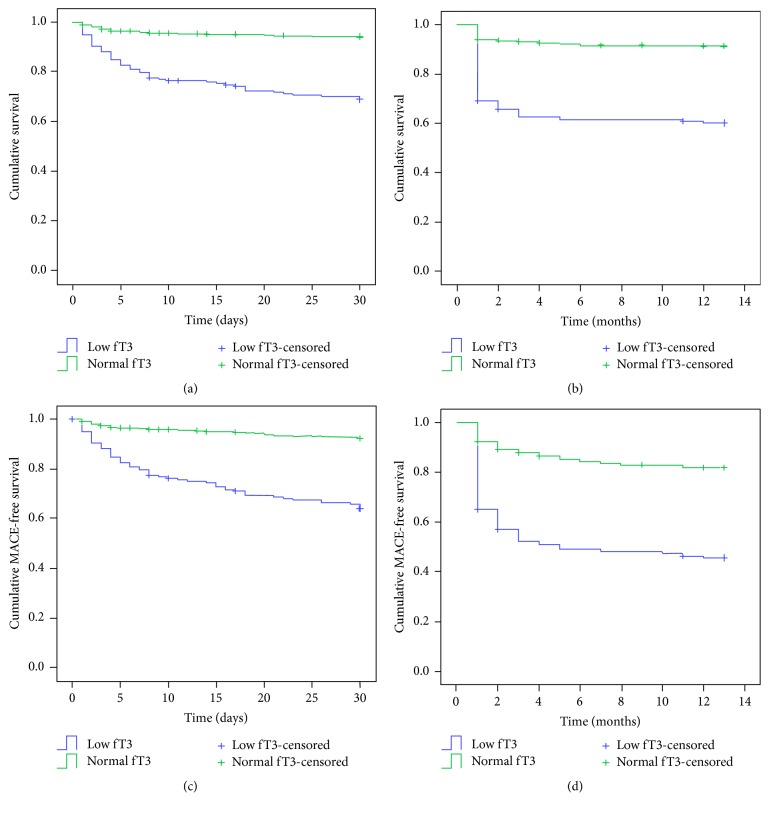
Figure 1.
Kaplan-Meier survival curves for (a) 30-day mortality, (b) 1-year mortality, (c) 30-day major adverse cardiac events (MACE), and (d) 1-year MACE in patients in the low and normal fT3 groups. The log-rank tests showed that all four parameters (mortality and MACE occurrence) were higher in the low fT3 group than in the normal fT3 group (all P < 0.001). After adjustment for age and sex, all associations remained significant, except for 30-day and 1-year mortality and 30-day MACE in female >75 years of age (all P > 0.05); only the difference in 1-year MACE remained significant (P = 0.019).

