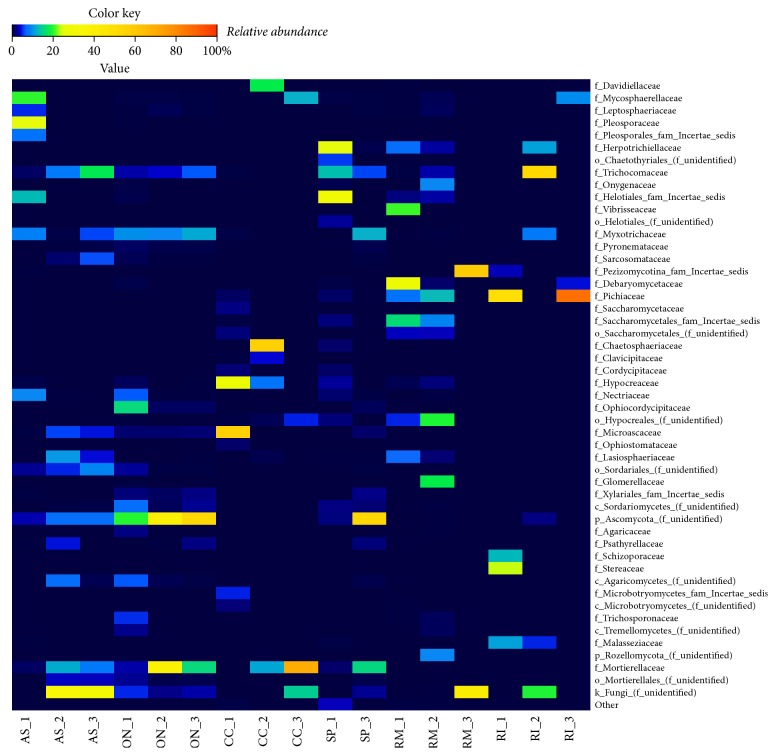
Figure 7.
Heatmap illustrating the relative abundance of fungal taxa among larval gut mycobiome (family level). Abbreviations of samples in figure in accordance with the scientific names of beetles (A. solstitiale: AS; O. nasicornis: ON; C. cinnaberinus: CC; S. pectinicornis: SP; R. mordax: RM; R. inquisitor: RI) and the order of the individual larva (SP_2 sample was excluded from analysis due to the low sequencing depth). Only taxa comprising at least 2% relative abundance in at least one sample are presented.

