Fig. 7.
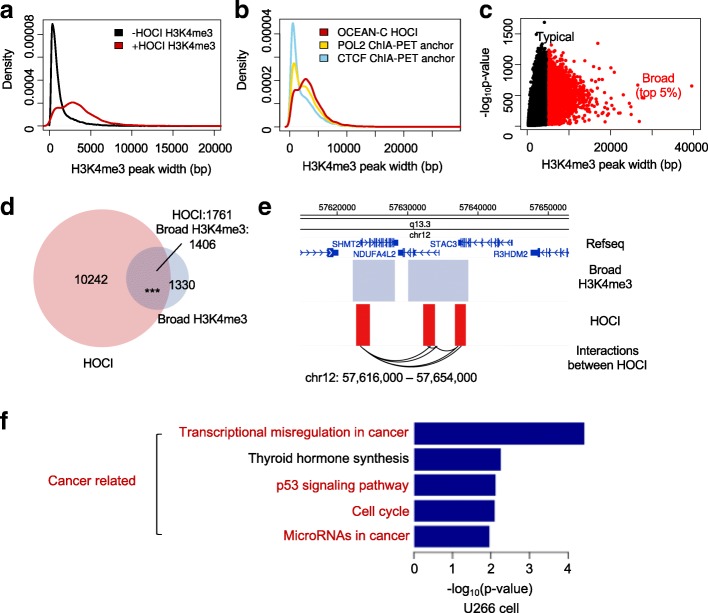
Overlaps between HOCIs and broad H3K4me3 domains. a The width distribution of H3K4me3 peaks. Red, H3K4me3 peaks overlapped with HOCIs; black, not overlapped with HOCIs (GM12878). b The width distribution of H3K4me3 peaks. Red, overlapping HOCIs; gold, overlapping POL2 ChIA-PET anchors; blue, overlapping CTCF ChIA-PET anchors (GM12878). c The -log10p-value of H3K4me3 peaks (y-axis) are plotted against peak width (x-axis). Black and red dots indicate typical and broad H3K4me3 peaks, respectively (U266). d Venn diagram of HOCIs and broad H3K4me3 peaks (U266). e Browser view of a genomic region in chromosome 12, showing the interactions within and between broad H3K4me3 regions (U266). Interactions between HOCI, both ends of OCEAN-C read pairs mapped to HOCIs. f KEGG pathway enrichment analysis of genes whose promoters are associated with both HOCIs and broad H3K4me3 peaks, while using all genes whose promoters are associated with HOCIs as background

