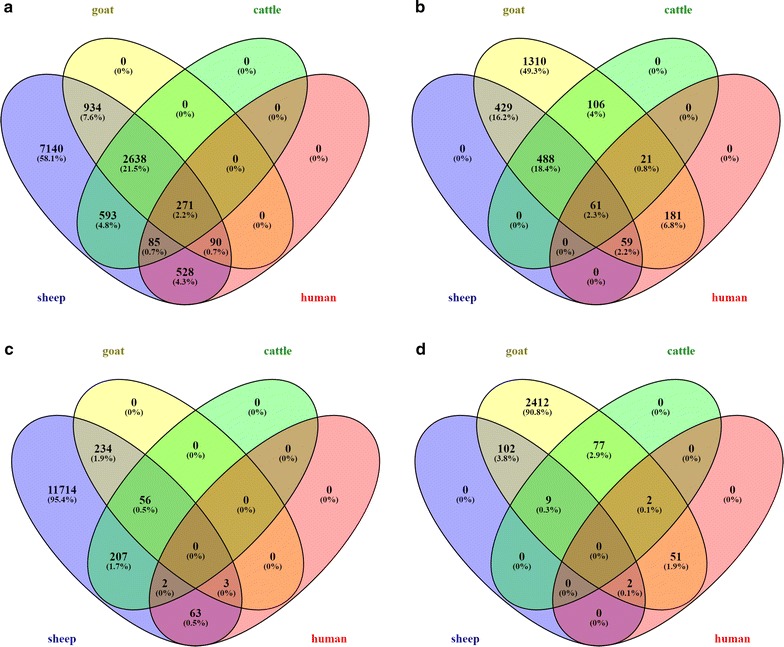
Fig. 1.

Minimal overlap of lncRNAs at the sequence level. Venn diagrams show the number of sheep (a and c) or goat (b and d) lncRNAs that can be aligned—either with an alignment of any length or quality (A and B), or with ≥ 50% identity over ≥ 50% of the length of the target sequence (c and d)—to either shortlist of goat (a and c) or sheep (b and d) lncRNAs, and to sets of cattle and human lncRNAs from previous studies. The majority (58% of sheep lncRNAs, and 49% of goat lncRNAs) have no associated alignment. Alignments are detailed in Additional file 1: Table S10 (sheep) and Additional file 1: Table S11 (goat)
