Figure 3.

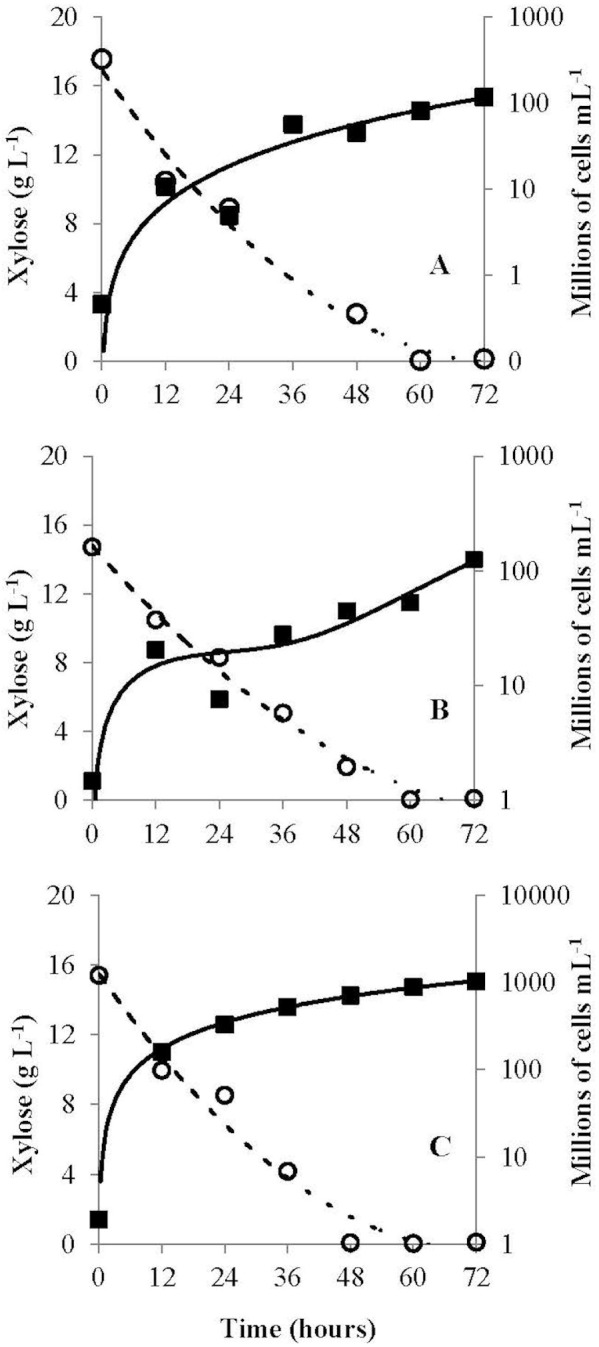
Progress curve (cell growth vs carbohydrate consumption) of G. geotrichum UFVJM-R10 (A), G. geotrichum UFVJM-R150 (B) and C. akabanensis UFVJM-R131 (C). Open circle, xylose concentration; full square, cell growth.

Progress curve (cell growth vs carbohydrate consumption) of G. geotrichum UFVJM-R10 (A), G. geotrichum UFVJM-R150 (B) and C. akabanensis UFVJM-R131 (C). Open circle, xylose concentration; full square, cell growth.