
Figure 1.
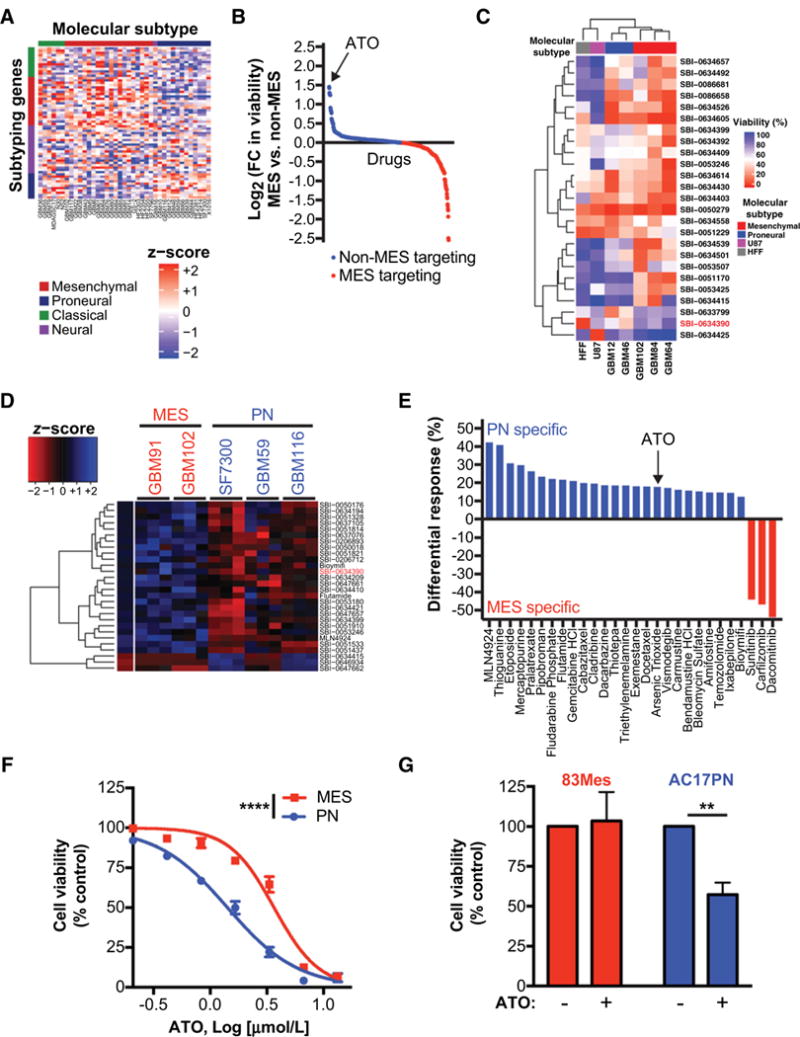
High-throughput screens identify differential ATO sensitivity in PN and MES GBM. A, RNA was extracted from orthotopically grown GBM PDX models. Transcriptomic profiling was performed using Agilent 44K array. Expression data was filtered for mouse contamination and molecular subtype analysis was performed using 66 subtype classification according to Verhaak et al. (22). B and C, Preliminary CellTiter-Glo viability screen was performed on short-term cultures of GBM PDX models, U87, and Human foreskin fibroblast (HFF) at 10 μmol/L. Only compounds with a statistically significant differential effect on cell viability are shown in the graph and heatmap. In this preliminary screen against 650 compounds, ATO (SBI-0634390; red) was identified as a small molecule with specificity towards non-MES GBM cells. D and E, ATO specificity was further validated by a secondary CellTiter-Glo viability screen, where selected 120 compounds were screened against short-term cultures of GBM PDX models at three different concentrations (0.1, 1, and 10 μmol/L). Only compounds with a statistically significant differential effect on cell viability are shown in the graph and heatmap. Averages for triplicates for each concentration are presented in the heatmap (D). Differential responses to compounds (E) show PN and MES specific compounds. F, Subtype-specific effects of ATO were further validated by performing dose-response experiments against selected MES and PN GBM ex vivo PDX models. Non-linear dose-response curve fit, F test,*****, P ≤ 0.0001. G, 83Mes and AC17PN GSCs were treated with ATO (1 μmol/L) for 5 days and cell viability was analyzed by WST-1 assay. Data represent means ± SEM of three independent experiments. Unpaired, two-tailed t test,**, P ≤ 0.01.