Figure 4.

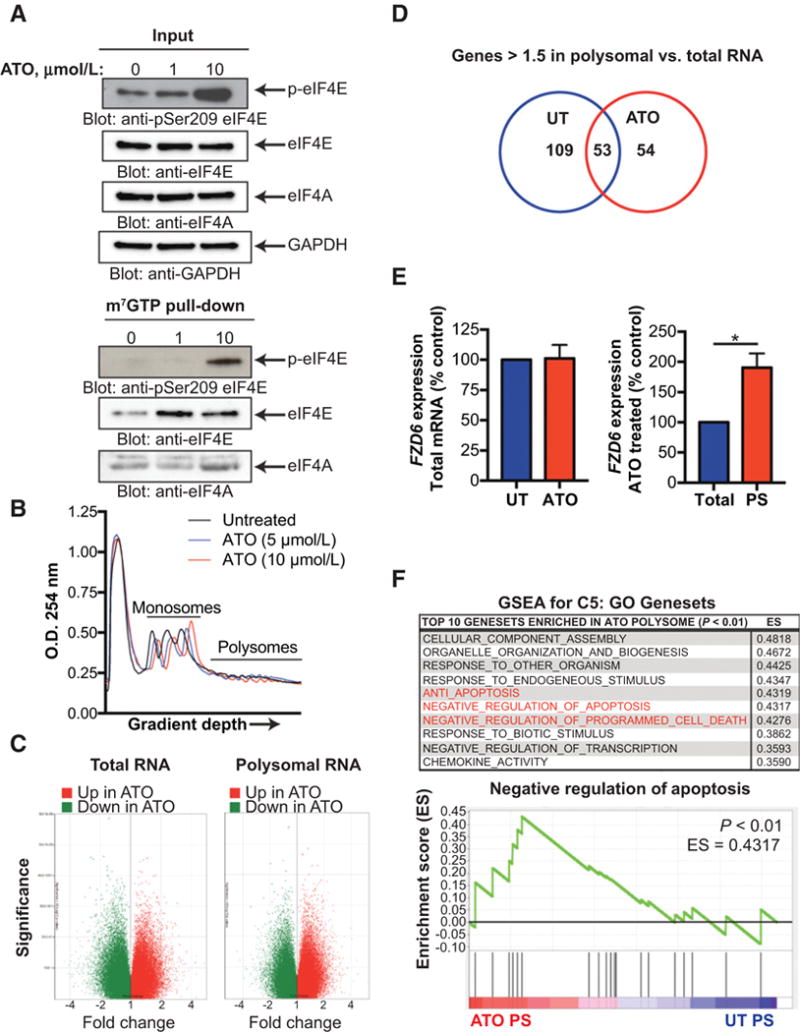
Polysomal profiling reveals ATO-induced translatome in GBM. A, LN229 cells were treated with increasing concentrations of ATO for 6 hours. Whole cell extracts were incubated with m7GTP-Agarose beads overnight. m7GTP-Agarasoe pull-down and input control were subjected to SDS-PAGE followed by immunoblotting with antibodies against phospho-eIF4E (Ser209), eIF4E, eIF4A, or GAPDH. B, LN229 cells were treated with increasing concentrations of ATO for 6 hours. Following treatment, cells were lysed with hypotonic lysis buffer, separated by a sucrose gradient (10–50%), and the O.D. 254 nm was analyzed. Graph represents O.D. as a function of gradient depth. C and D, LN229 cells were treated as in B. Total and polysomal mRNA were isolated and transcript expression was analyzed using the Clariom D microarray. Coding genes up- or downregulated after ATO treatment in polysomal and total RNA are shown. Genes >1.5 times increased in polysomal RNA as compared to total RNA for untreated and ATO treated cells are shown in the Venn diagram. E, Total and polysomal mRNA (as in B) was isolated and pooled and relative FZD6 mRNA expression was determined by qRT-PCR using GAPDH for normalization. Data represent means ± SEM of three independent experiments. Unpaired, two-tailed t test,*, P ≤ 0.05. F, Gene expression of ATO polysomes and total polysomes was analyzed by GSEA. The top 10 C5: GO gene sets enriched in ATO polysomes as compared to untreated polysomes are listed. Gene sets involved in apoptosis or cell death are highlighted in red. Enrichment plot of the negative regulation of apoptosis (GO:0043066) gene set in untreated and ATO polysomes is shown. Nominal P < 0.01.
