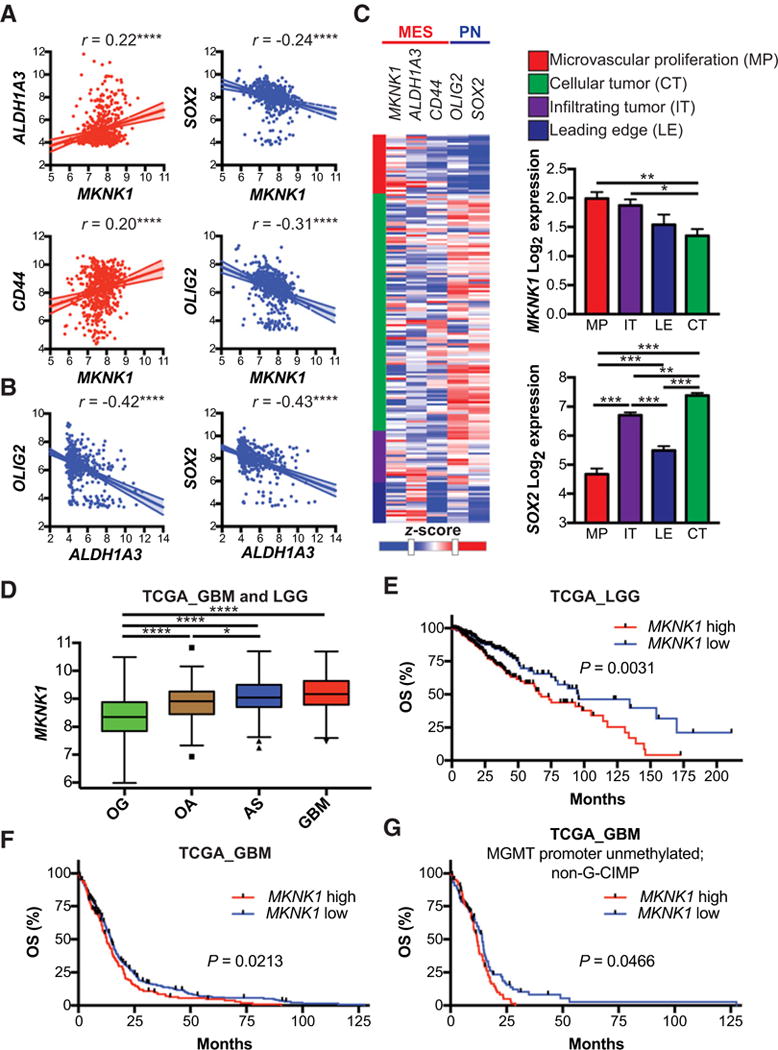
Figure 5.

Expression of MES GSC markers correlate with MKNK1 and MKNK1 expression predicts poor survival in GBM patients. A and B, Multiple correlation analysis of MES and PN GSC markers in TCGA patients. Pearson’s correlation analysis,****, P ≤ 0.0001. C, Heatmap showing expression of MKNK1, MES GSC markers (ALDH1A3, CD44) and PN GSC markers (OLIG2, SOX2) in different tumor regions: microvascular proliferation (MP), infiltrating tumor (IT), leading edge (LE), and cellular tumor (CT). Bar graphs depict summarized data from heatmap. Comparisons between MKNK1 and SOX2 means in different tumor regions is shown with Tukey’s honest significant difference test,*, P ≤ 0.05; **, P ≤ 0.01;***, P ≤ 0.001. D, Expression of MKNK1 in GBM and low-grade gliomas: oligodendroglioma (OG), oligoastrocytoma (OA), and astrocytoma (AS). One-way ANOVA,*, P ≤ 0.05;****, ≤ 0.0001. E and F, Overall survival (OS) analysis of low-grade glioma (E), all GBM (F), and MGMT promoter unmethylated; non-G-CIMP GBM (G) patients with high and low expression of MKNK1 (MNK1). Log-rank (Mantel-Cox) test P-values are shown. Expression data downloaded from GlioVis (http://gliovis.bioinfo.cnio.es; ref. 57). Heatmap generated using the IVY Glioblastoma Project. ©2015 Allen Institute for Brain Science. Ivy Glioblastoma Atlas Project. Available from: glioblastoma.alleninstitute.org.
