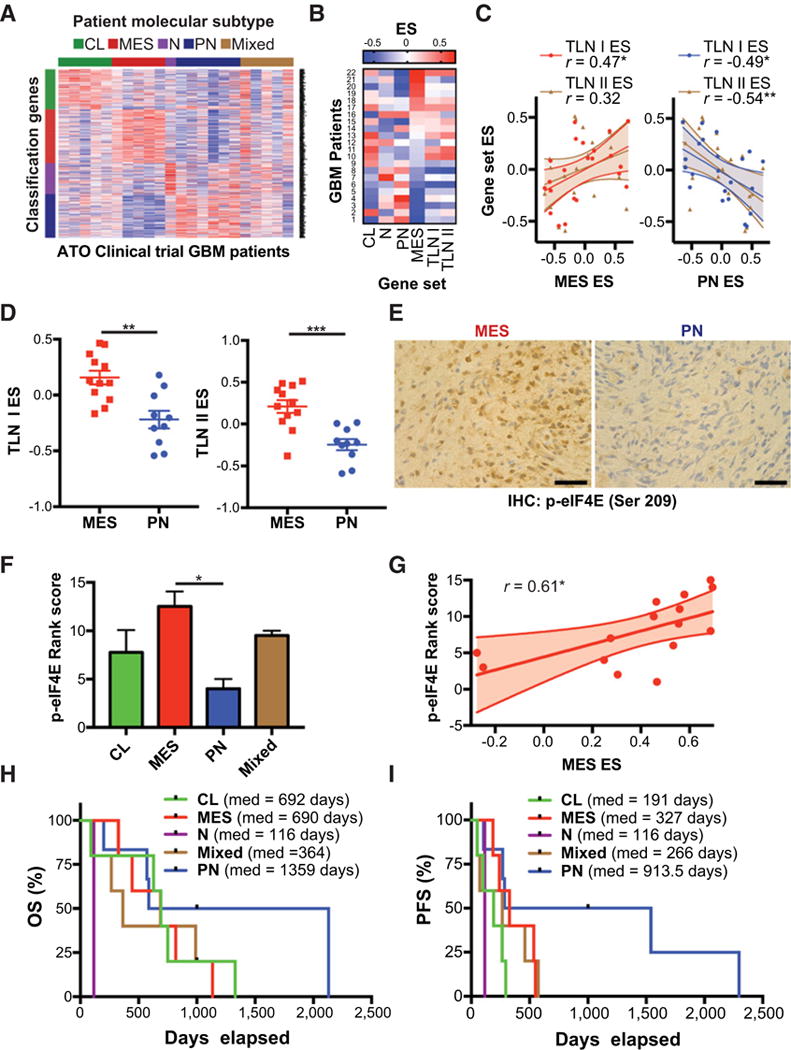
Figure 7.

PN GBM phenotype associated with improved outcomes in ATO clinical trial. A, Tumor samples from 22 patients enrolled in a phase I/II trial of Trisenox (ATO) were analyzed by RNA-sequencing to determine molecular subtyping according to Verhaak et al. [22]. B and C, Gene set variation analysis (GSVA) of 22 patient samples. Heatmap shows GSVA enrichment scores for patients ranked according to MES ES. Pearson’s correlation analysis shows relationship between MES enrichment score (MES ES) or PN enrichment score (PN ES) and translation enrichment scores (TLN I ES, TLN II ES),*, P ≤ 0.05. D, Comparison of translation gene set enrichment scores in patients subtyped according to Carro et al. (41) (MES vs. PN). Unpaired, two-tailed t test **, P ≤ 0.01;***, P ≤ 0.001. E and F, Tumor samples were analyzed by phospho-eIF4E IHC and ranked per staining intensity. Representative phospho-eIF4E staining from MES and PN GBM patients are shown, scale bar = 50 μm. Mean staining rank score are shown for each subtype with available tumor with higher rank score corresponding with higher phospho-eIF4E intensity. One-way ANOVA,*, P ≤ 0.05. G, Correlation analysis shows relationship between MES ES and phospho-eIF4E staining rank score, *, P ≤ 0.05. H and I, Overall survival (OS) and PFS analyses for different molecular subtypes are shown.
