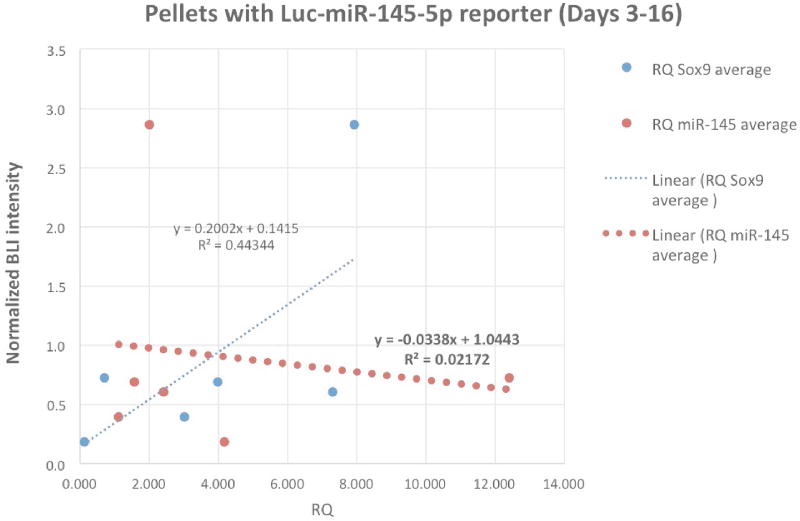
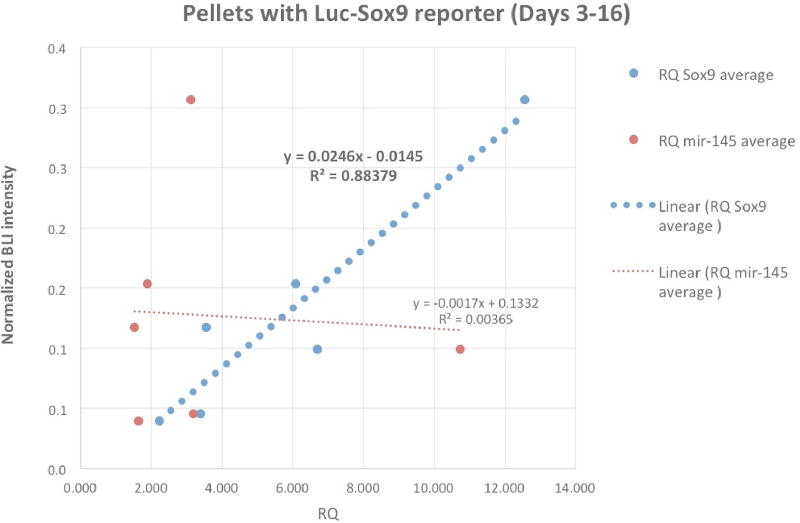
Figure 6.
Correlation between the imaging signal (BLI) from using the reporter and its associated endogenous gene expression (PCR) with the dotted lines for linear regression (Days 3 – 16). A) The thick orange dotted line shows regression in pellets transfected with Luc-miR- 145-5p reporter between normalized BLI signal vs. miR-145-5p level from qRT-PCR.
B) The thick blue dotted line showing regression in Luc-Sox9 transfected pellets between normalized BLI signal vs. Sox9 mRNA from qRT-PCR.


