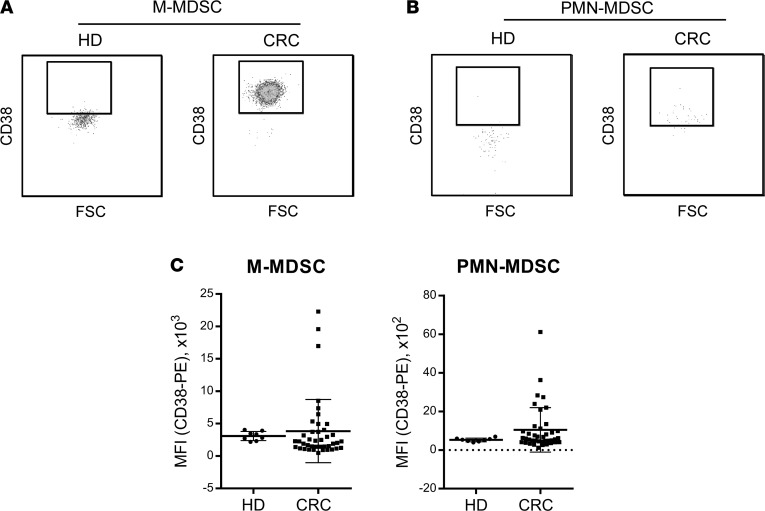
Figure 3. CD38+ M- and PMN-MDSCs expand in the peripheral blood of CRC patients when compared with healthy donors.
See also Supplemental Figures 2 and 3. (A and B) Representative plots showing expression levels of CD38 on M-MDSC (A) and PMN-MDSC (B) populations (CD14+HLA-DRlo and low-density CD14–CD11b+CD15+, respectively) from PBMCs of an HD and a CRC patient. CD38 expression levels (MFI) on M- and PMN-MDSCs from HDs and CRC patients; mean values and SDs are plotted as horizontal lines. Statistical data are presented in Table 4.

