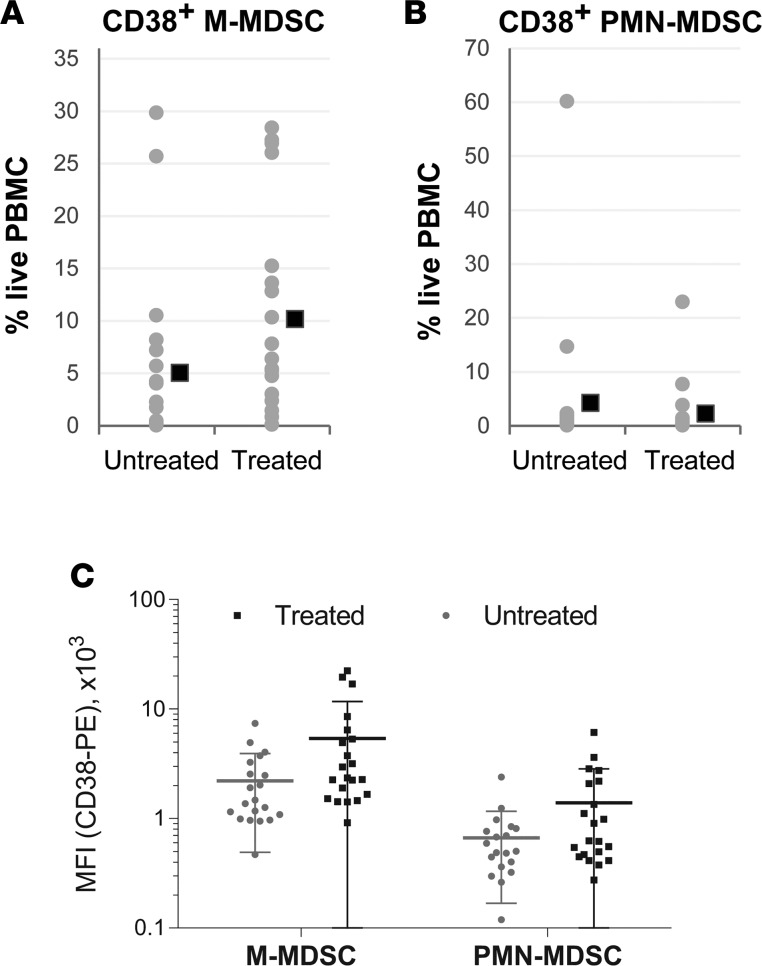
Figure 5. CD38+ M- and PMN-MDSCs expand in peripheral blood of CRC patients who underwent treatment.
See also Supplemental Figure 4. The frequencies of CD38+ M-MDSCs (A) and CD38+ PMN-MDSCs (B) in the live subset of PBMCs from treatment-naive CRC patients or patients who received chemotherapy. Gray dots represent individual values; black squares, mean values. (C) Expression levels of CD38 on the surface of M-MDSCs or PMN-MDSCs from PBMCs of CRC patients, expressed as MFI. Statistical data are presented in Table 6.

