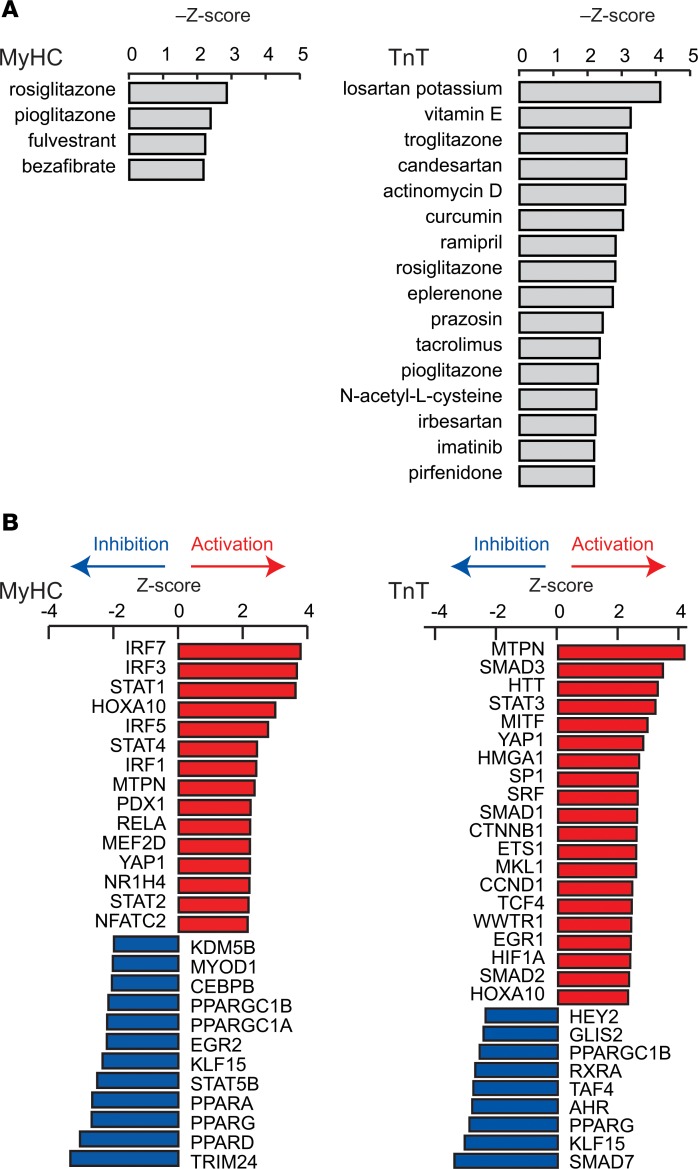
Figure 12. Identification of candidate therapeutics and upstream transcriptional regulators.
(A) Candidate therapeutics that are predicted to revert the dysregulated signaling pathways in the mutants back to that in controls. Candidate therapeutics with –Z scores >2.19 are shown. (B) Predicted change in the activity of transcriptional regulators that can explain dysregulation of the signaling pathways shown in Figure 2 in mutants. Transcriptional regulators with Z scores >2.3 or <–2.3 are shown for MyHC mutants and >2.0 or <–2.0 for TnT mutants

