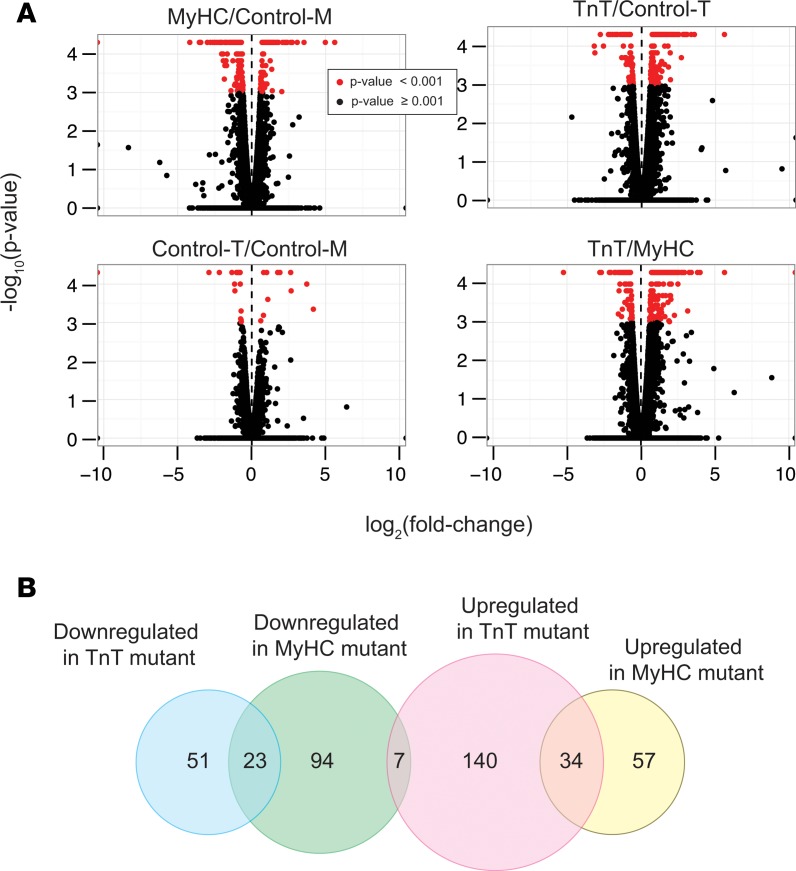
Figure 2. mRNA-seq analysis.
(A) Volcano plots showing the log2(fold change) and –log10(P value) of each mRNA in the pairwise comparison of the 2 mouse genotypes; mRNA data with P < 0.001 (q < 0.05) using 2-sided unpaired Student’s t test (n = 3 biological replicates) is depicted in red. (B) Venn diagram illustrating number of genes that are upregulated or downregulated in MyHC and TnT mutants (total number of genes, 406).

