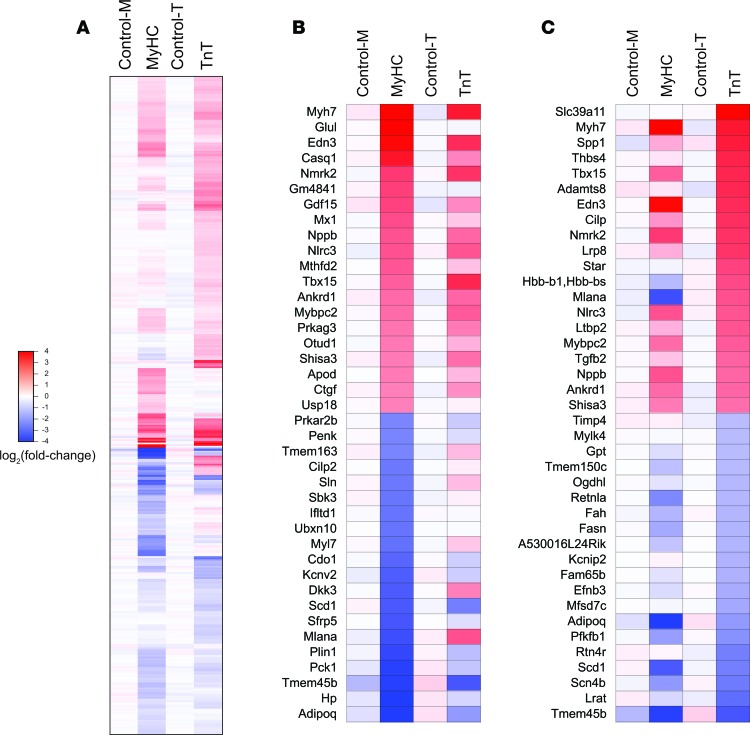
Figure 3. mRNA-seq analysis.
(A) Heatmap illustrating fold-change in abundance of each mRNA relative to the mean of the littermate controls (the mean of control-M and control-T); 406 genes were differentially expressed (P < 0.001, q < 0.05, using 2-sided unpaired Student’s t test [n = 3 biological replicates]) in MyHC or TnT mutants, when compared with their respective littermate controls; differences in expression of 14 genes were observed in the 2 controls. The mRNAs are shown in descending order of fold change in abundance in the TnT mutants. (B and C) Heatmap showing fold change in the abundance of each mRNA relative to the mean of control-M and control-T. The top 20 upregulated and downregulated genes in MyHC (B) and TnT (C) mutants are shown. The mRNAs are shown in descending order of fold change in abundance in MyHC (B) and TnT (C) mutants.

