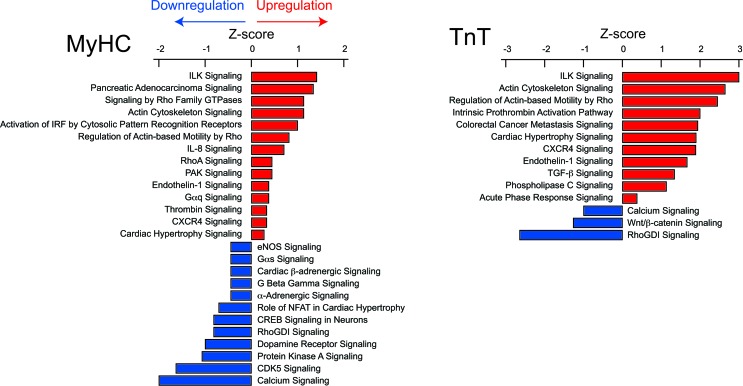
Figure 4. Ingenuity pathway analysis of mRNA-seq data.
IPA identified pathways that were significantly (P < 0.032) upregulated (Z score > 0) or downregulated (Z score < 0) in MyHC and TnT mutants. All pathways (P < 0.032), including those whose Z scores could not be determined, are shown in Supplemental Table 4.

