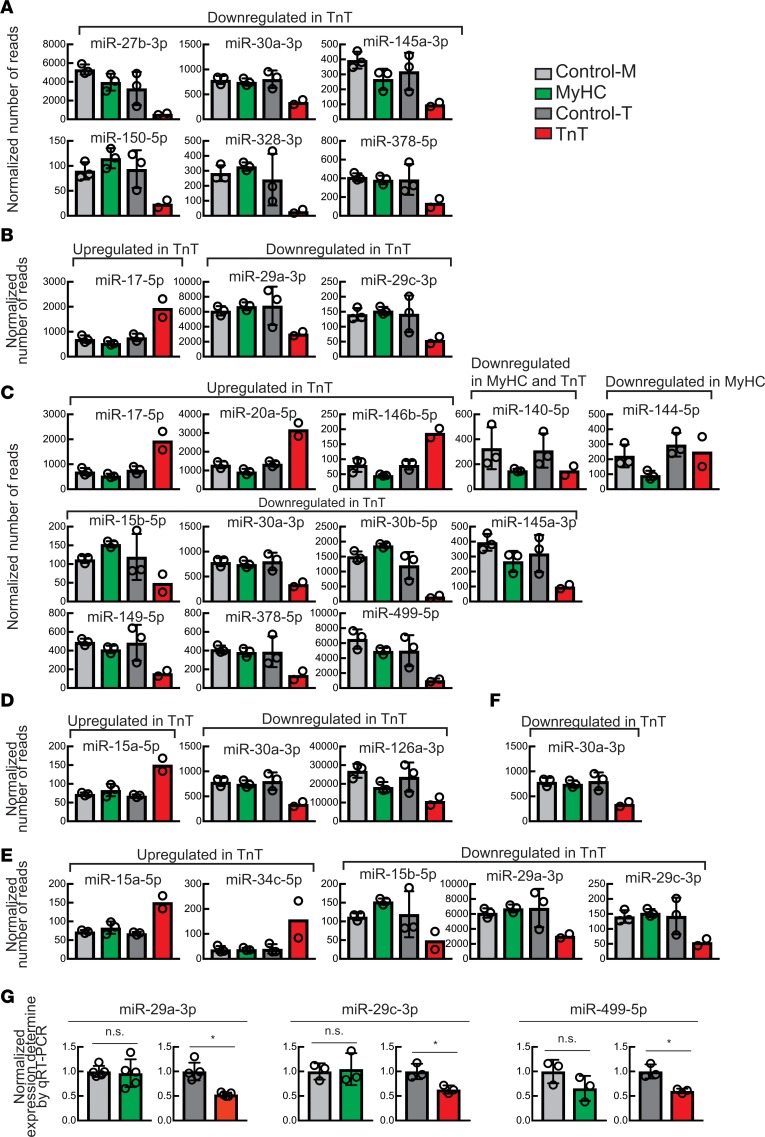
Figure 6. Differentially expressed miRNAs implicated in cardiac disease and mitochondrial function.
(A–F) Abundance (reads per million) of miRNAs that show >2-fold change in MyHC or TnT mutants compared with their littermate controls and have been implicated in (A) cardiac hypertrophy, (B) cardiac fibrosis, (C) cardiac apoptosis, (D) mitochondrial function, (E) myocardial infarction, and (F) autophagy. Mean ± SD (n = 2 biological replicates for TnT, and n = 3 biological replicates for all other mice). (G) Normalized expression of miR-29a-3p, miR-29c-3p, and miR-499-5p determined by qRT-PCR. The miRNA levels were normalized by miR-30a-5p level, which did not show change in the miRNA-seq data (Supplemental Table 7). Expression in MyHC and TnT mutants was normalized to that of their respective littermate controls. Mean ± SD (n = 5 biological replicates for miR-29a-3p, and n = 3 biological replicates for miR-29c-3p and miR-499-5p); *P < 0.05 using 2-sided Student’s t test.

