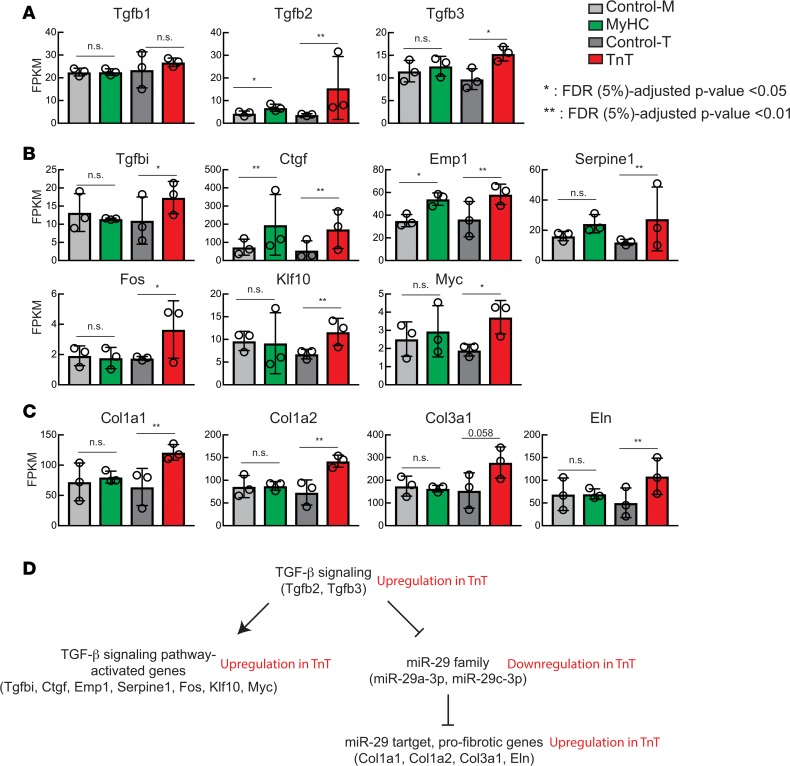
Figure 7. TGF-β–miR-29–collagen axis.
(A) mRNA levels (fragments per kilobase of exon per million fragments mapped [FPKM]) of TGF-β genes revealed by mRNA-seq. (B) mRNA levels of genes whose transcription is known to be increased by activation of TGF-β signaling. (C) mRNA levels of collagen and elastin genes that are known to be suppressed by the miR-29 family of miRNAs. (D) Summary of TGF-β–miR-29–collagen axis and changes in TnT mutants. Mean ± SD (n = 3 biological replicates); *P < 0.01 and **P < 0.001, using 2-sided Student’s t test.

